This year’s Annual StaSIO Competition was a success! We received more than 40 submissions, which were carefully reviewed by our impressive jury. The winners were announced at the 2023 BPAC conference, where some of the awardees were able to present their graphics to an excited audience.
As a first, the upcoming 2024 Annual Competition will include all graphics submitted throughout the year cycle, so don’t hesitate to submit your favorite graphics now!
Overall Winner
What is the impact of geothermal heat exchange, air source heat pumps, and sanitary heat exchange on a cold climate multi-family high rise electrification while keeping costs low?
Submitted By: Kate Bren
Submission Detail: The top portion of this graphic focus on the quantitative impacts of various electrification measures and system upgrades. The top left graph shows the additive impacts of the upgrades on EUI, gas, and electricity. The center graph shows annual EUI by end use. The right graph shows how EUI varies from month to month by end use. The bottom illustration demonstrates the HVAC system and the sanitary system loops within the building.
Student Winner
What is the impact of occupant behavior on daylight availability in homes?
Submitted by: Swetha AB
Submission Detail: This graphic tries to show the impact of occupant behaviour on daylight availability in homes, where Home-A, B and C shows the average available daylight in homes over a week. Homes A and B have the same orientation and the same WWR of 63%. In Home-A, the peak available daylight (vertical illuminance on the wall) exceeded 200 lux, but in Home- B the peak available daylight levels was 50 lux. This showed a large impact of occupant behaviour on daylight access in homes (from the field study). Home- C has Window to Wall Ratio of 35%, where the average available daylight was less than 25 lux, and the home shows the reliance on artificial light during daytime due to less daylight access inside the home. Home-D shows the comparison between simulated daylight access (simulation) to ground reality with occupant behaviour, where there has been a gap of 61.72% from daylight potential to the ground reality. And 80.09% from ideal daylight to the ground reality. This gap is caused due to weather differences and occupant behaviour of curtailing (trade-off) the daylight access to maintain thermal and visual comfort in the home.
Honorable Mention
Clarity
What is the impact of horizontal shading on zone sensible cooling loads?
Submitted By: Ayush Mandviya
Submission Details: The graphics represent the simulation analysis carried out for different overhang sizes for the summer design week. The 3D diagram of a typical floor plan describes the core and perimeter zones. The schematic section represents reduced incident solar radiation on windows by increasing overhang depth. The bar graph gives an overview of the percentage reduction in the zone sensible cooling load by alterations in the overhang depth for the windows in each cardinal direction of the perimeter zones.
Innovation
What is the impact of Heating and Cooling load on several facade designs?
Submitted By: PrethviRaj RamasamyManoharan
Submission Details:The matrix shows the possible facade designs under a specific heating or cooling demand. The variables are different orientations (North, South, East, West) with varying glass percentages (30%,50%,60%,70%,90%), shading types (Horizontal, Vertical, Combined) and angles (No (0°), 30°,45°,60°). Possible facade models are shown on the right side of the matrix. The slider on the top for heating and cooling capacity can be altered to see the several design options the designer can choose from in incoordination with the chosen energy concepts during the sketch design.
Insightfulness
What is the impact of component optimization as per ECBC on sensible cooling loads of office building in composite climate?
Submitted By: Mokshika Arora
Submission Details:The graphic shows the percentage & comparative reduction in sensible cooling load per m2 due to alterations in 3 envelope components: Glass, Wall, Roof. In the design cases, each component was altered as per ECBC (Energy conservation building code) compliance, individually and their corresponding effect on sensible cooling reduction is observed.
Aesthetic Design
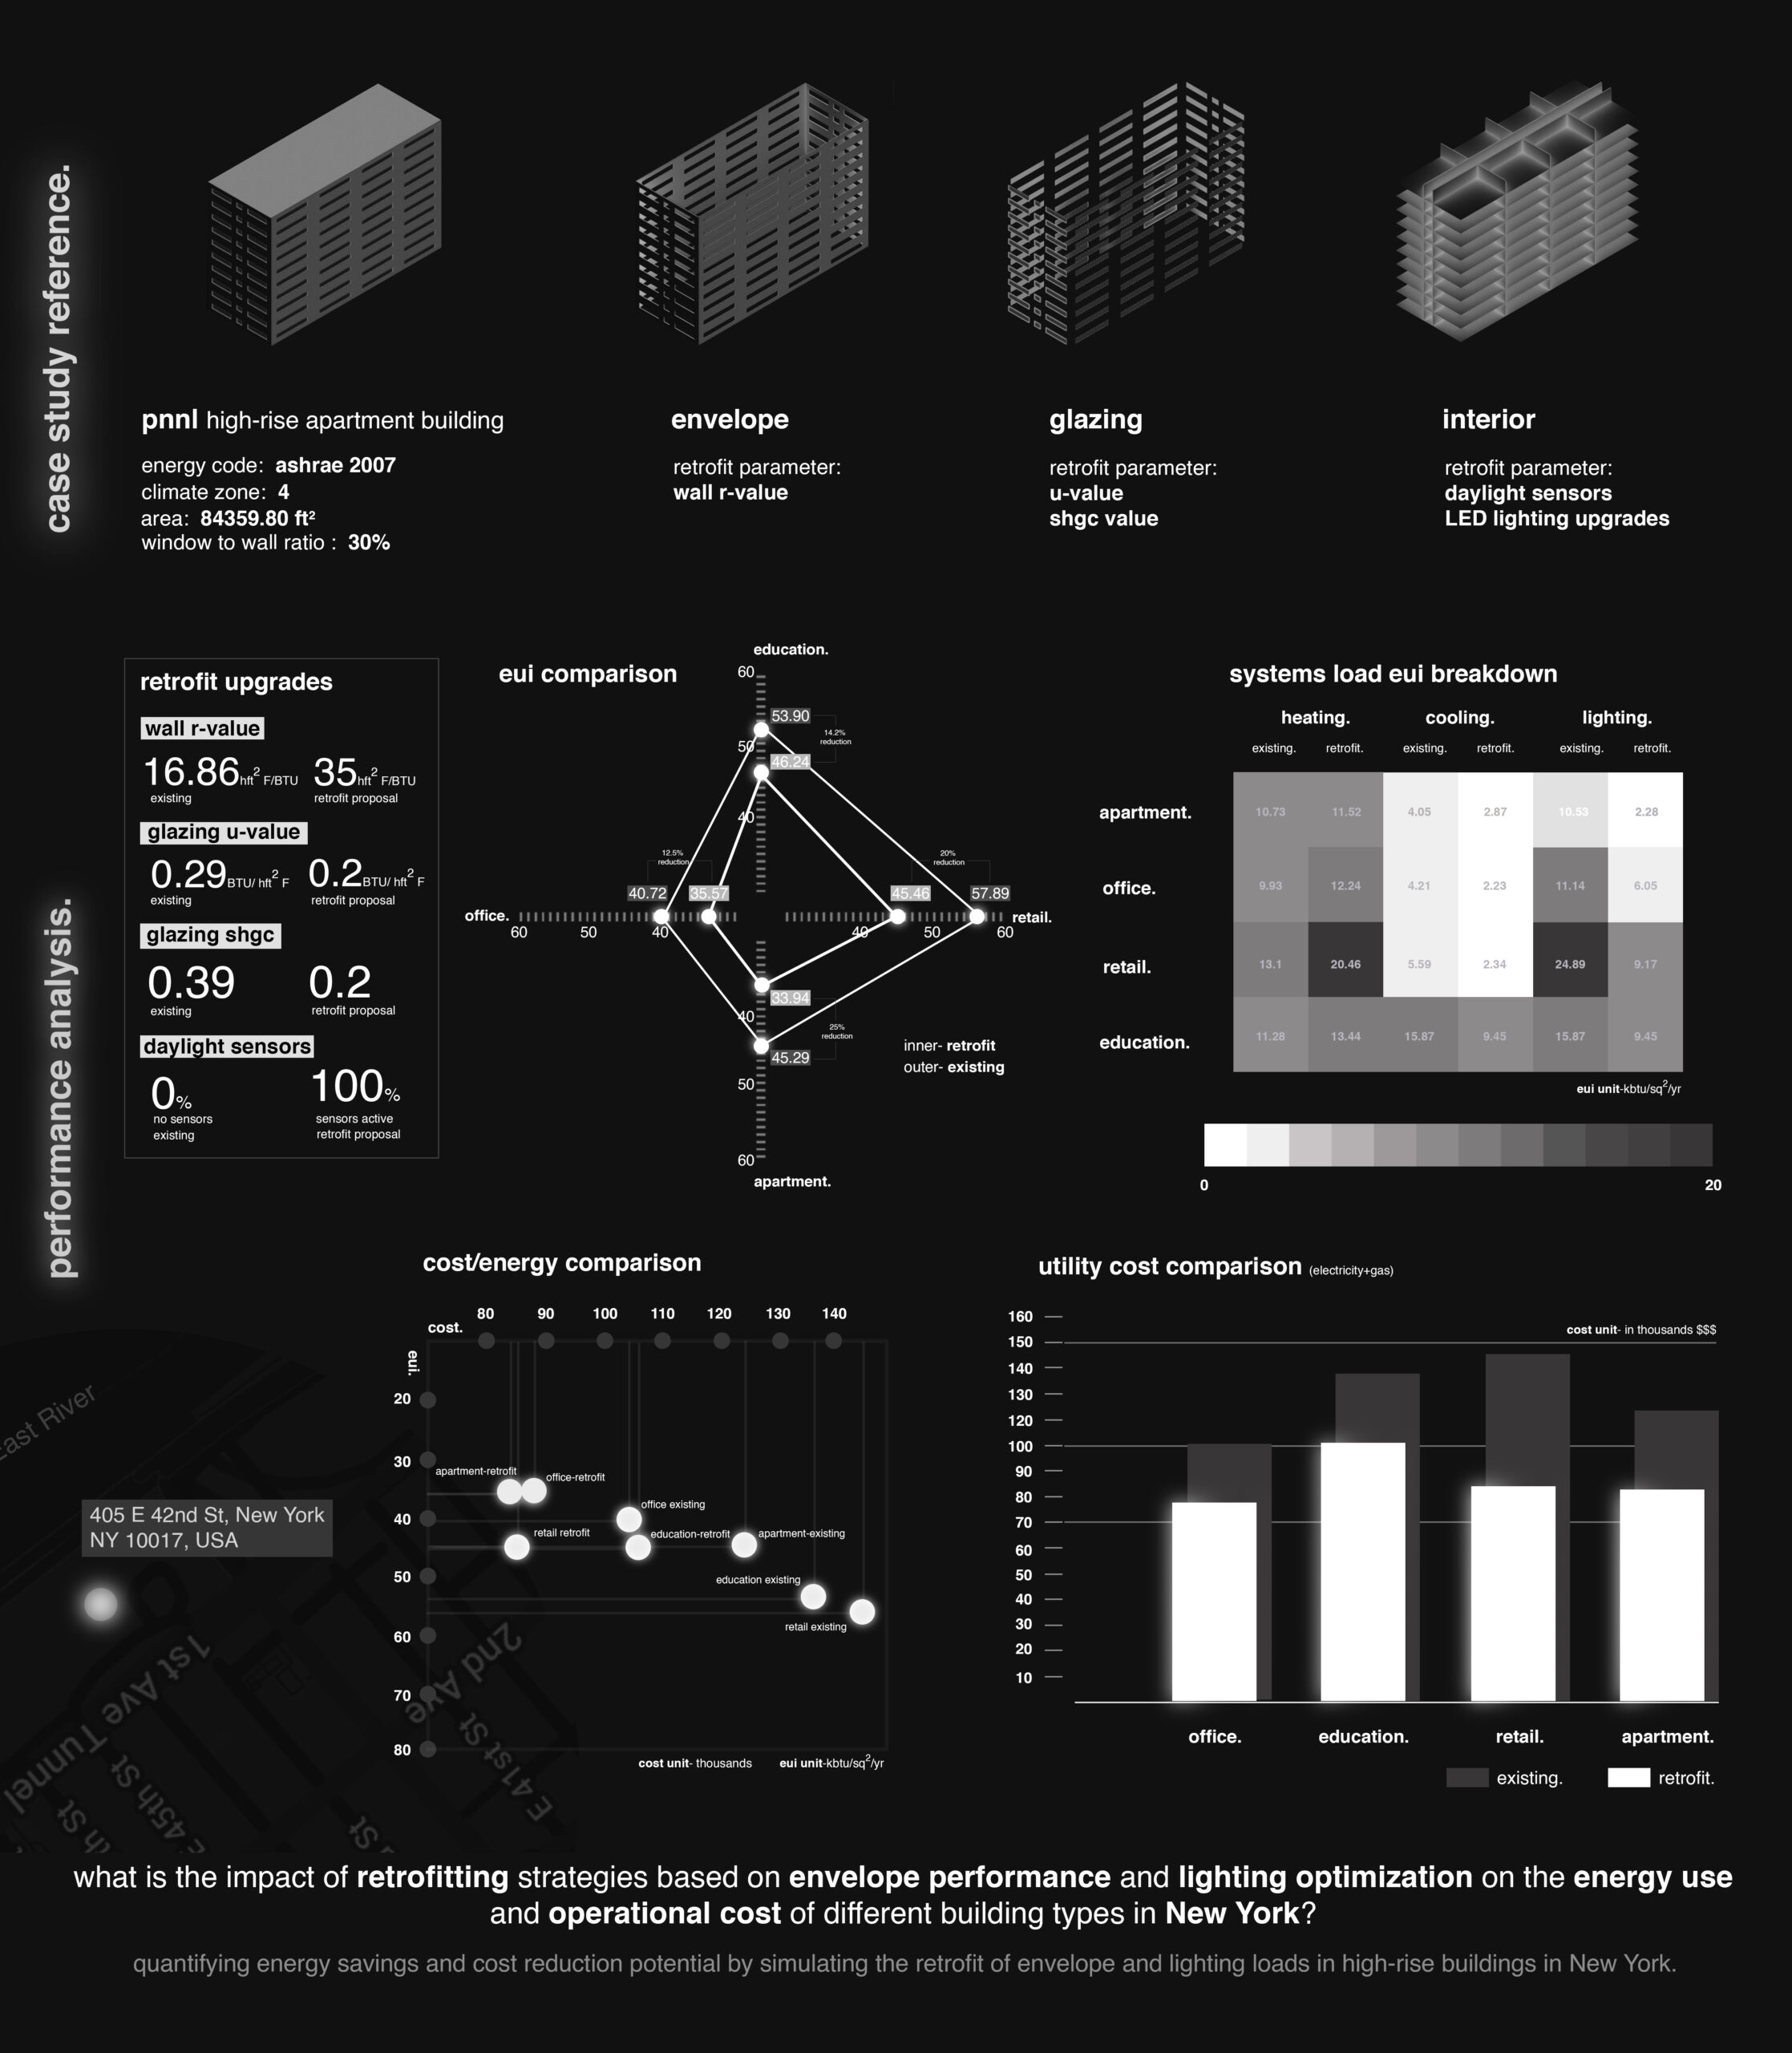
What is the impact of impact of retrofitting strategies based on envelope performance and lighting optimization on the energy use and operational cost of different building types in New York?
Submitted By: Udiksha Kapini
Submission Details:This graphic demonstrates the impact in terms of energy and operational cost savings with simple envelope and lighting retrofit strategies over different typologies – Office, Apartments, Retail and Education buildings in New York. A reduction in both Energy use Intensity and utility costs can be seen , implying that the impact of introducing upgrades to existing buildings rather than demolition +new construction can yield great cost savings in utility costs over the years in the City of New York.