OVERALL WINNER Annual Energy Savings by Strategy Type
CLICK IMAGE TO SEE FULL SUBMISSION
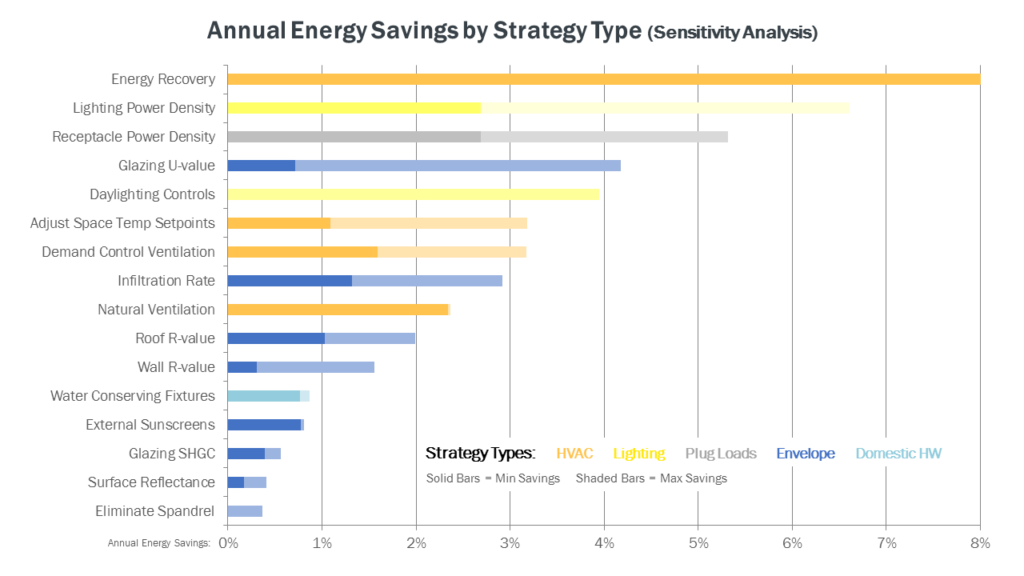
Submission detail: This graphic communicates the results of a sensitivity analysis evaluating the impact of different energy conservation measures (ECM’s) on the annual energy costs of a proposed office building design. ECM’s are color-coded by category and plotted along the vertical axis of a stacked bar graph, with their modeled annual energy savings plotted along the horizontal axis (in $ / yr). ECM’s are organized in descending order with those that resulted in the largest annual energy savings located at the top of the graph. A high and low range for the potential impact of each ECM is plotted on the graph through the use of solid and shaded bars.
Professional Energy Manager (PEM), LEED Accredited Professional (LEED AP), and Returned Peace Corps Volunteer (RPCV) with sixteen years of experience in corporate sustainability, energy efficiency, and sustainable development. My work focuses heavily on reducing clients’ operating costs and greenhouse gas emissions.
What our judges like about this submission:
“This top choice represents some valuable improvements on a basic type of chart, which can be easily adopted by other energy analysts. It highlights uncertainty in modeling results by presenting a range of savings for each measure, and the color coding effectively communicates the relative impact of envelope, HVAC and lighting measures.” – Erik Kolderup
“Despite being simplistic, the chart hit exactly the right level of detail in conveying which components were more important from an energy perspective. It was very easy to follow as well.” – Vrushali Mendon
HONORABLE MENTION Innovation Category
Residential Buildings In Houston
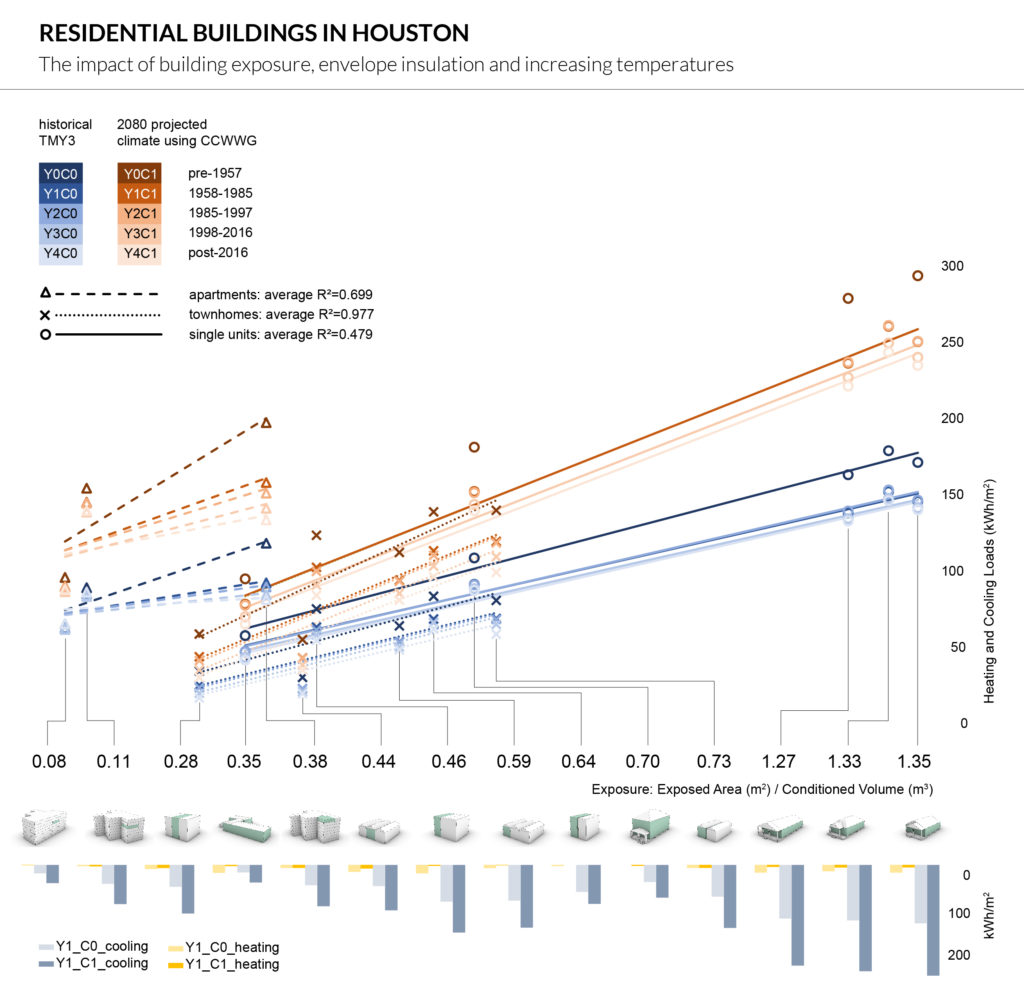
Submission detail: Building exposure (computed as Exposed Area over Conditioned Volume) is plotted against heating and cooling loads for 140 simulated simple box residential building cases. The cases are distinguished by 5 envelope compositions based on the effective code during the year they were built, and by 2 climate files, one being the historical TMY3 file and the other being the 2080 CCWorldWeatherGen projected climate file. Under the building typologies images, heating and cooling loads are plotted separately for the median frequency of envelope composition (Y1=1958-1985) for the historical TMY3 file (C0) and the 2080 CCWorldWeatherGen projected climate file (C1).
Mili Kyropoulou
Mili is an assistant professor at the Gerald D. Hines College of Architecture and Design at the University of Houston, and the co-founder of MEDiAM Design Collaborative. She is a RIBA Chartered Architect in the UK, Registered Architect in Greece, and LEED Accredited Professional. With over 12 years of experience, she has participated in numerous projects and competitions worldwide. Mili is the past president of IBPSA Houston chapter organizing its 2019-2020 Performance Huddle conferences.
Raffaella Montelli
Co-Creator
What our judges like about this submission:
They did a great job of showing lots of dissimilar information on a single chart in a way that was still lucid. – Vrushali Mendon
This graphic has several innovative features, and I think the most interesting is the plotting of heating and cooling loads as a function of a building’s surface to volume ratio, which is potentially useful information in early design. – Erik Kolderup
Special Thanks to our 2022 Judges
Vrushali Mendon
Vrushali Mendon is a Senior Research Engineer at the Pacific Northwest National Laboratory. Her background is in large-scale building energy analyses, including building modeling, regression-based analyses, statistical analyses of field experiments, cost-effectiveness and optimization. She has extensive experience in creating analytical frameworks for supporting energy and decarbonization policy decisions at the regional and national scale. Before re-joining PNNL, Vrushali was a Director at Resource Refocus LLC.
Erik Kolderup
Mr. Kolderup has provided sustainability and energy consulting services since 1990, when he joined Eley Associates as an energy engineer. He became an owner in 1994 and served as vice president until the firm’s merger with Architectural Energy Corporation in 2004. After three years as Associate Principal, sharing management of AEC’s San Francisco office, Mr. Kolderup started Kolderup Consulting in 2007. He is a registered professional engineer and an ASHRAE-certified Building Energy Modeling Professional. He is also a lecturer at Stanford University.