This year’s Annual StaSIO Competition was a success! We received more than 25 submissions, which were carefully reviewed by our impressive jury. The winners were announced at the 2024 SimBuild conference, where some of the awardees were able to present their graphics to an excited audience.
As a first, the upcoming 2025 Annual Competition will include all graphics submitted throughout the year cycle, so don’t hesitate to submit your favorite graphics now!
Overall Winner
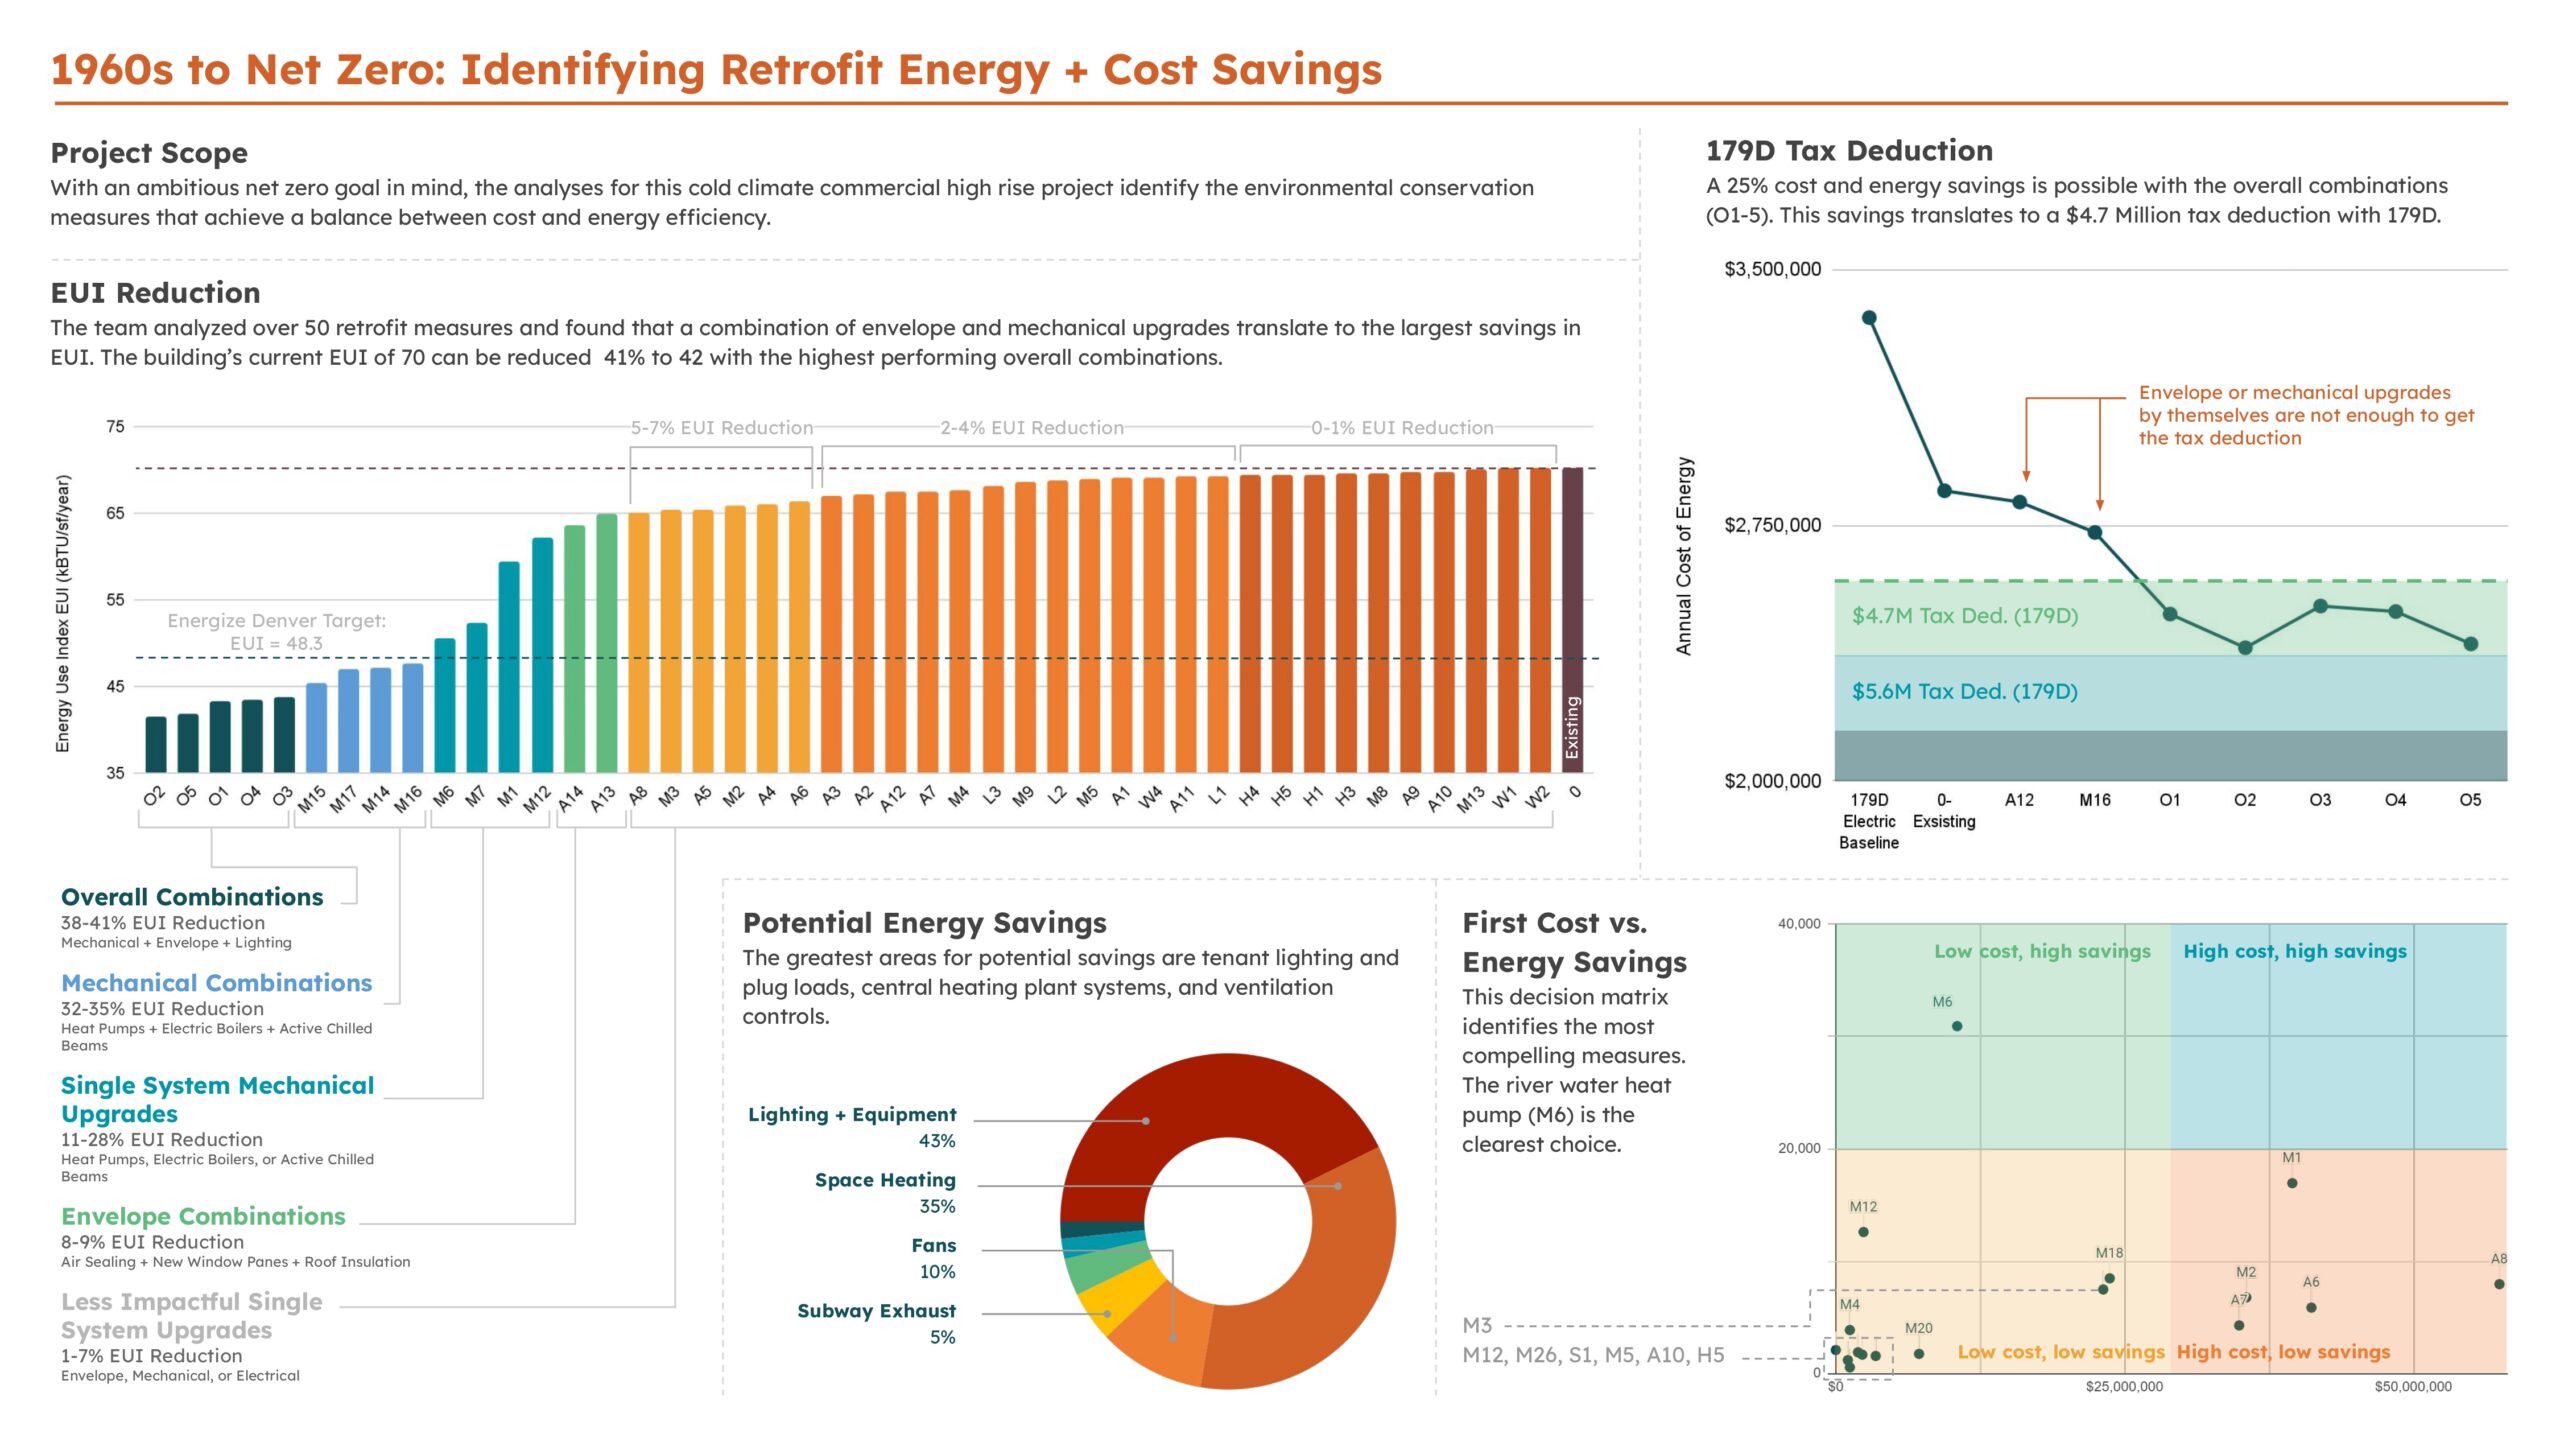
What is the impact of envelope, lighting, and mechanical upgrades on cost and energy efficiency of 1960s commercial high rise building?
Submitted By: Kate Bren
Submission Detail:This graphic shows around 50 energy conservation measures that were explored for the retrofit of a 1960s commercial high rise to become net zero. The top left rainbow bar chart graph demonstrates the impact of each measure on EUI in relation to the existing building and the Energize Denver EUI target of 48.3 kbtu/sf/yr. The top right line graph shows that a combination of envelope and mechanical upgrades are necessary to attain the 179D tax incentive. The bottom right graph shows the cost of each measure relative to the energy savings. Lastly, the donut chart demonstrates where the greatest potential for savings reside.
Student Winner
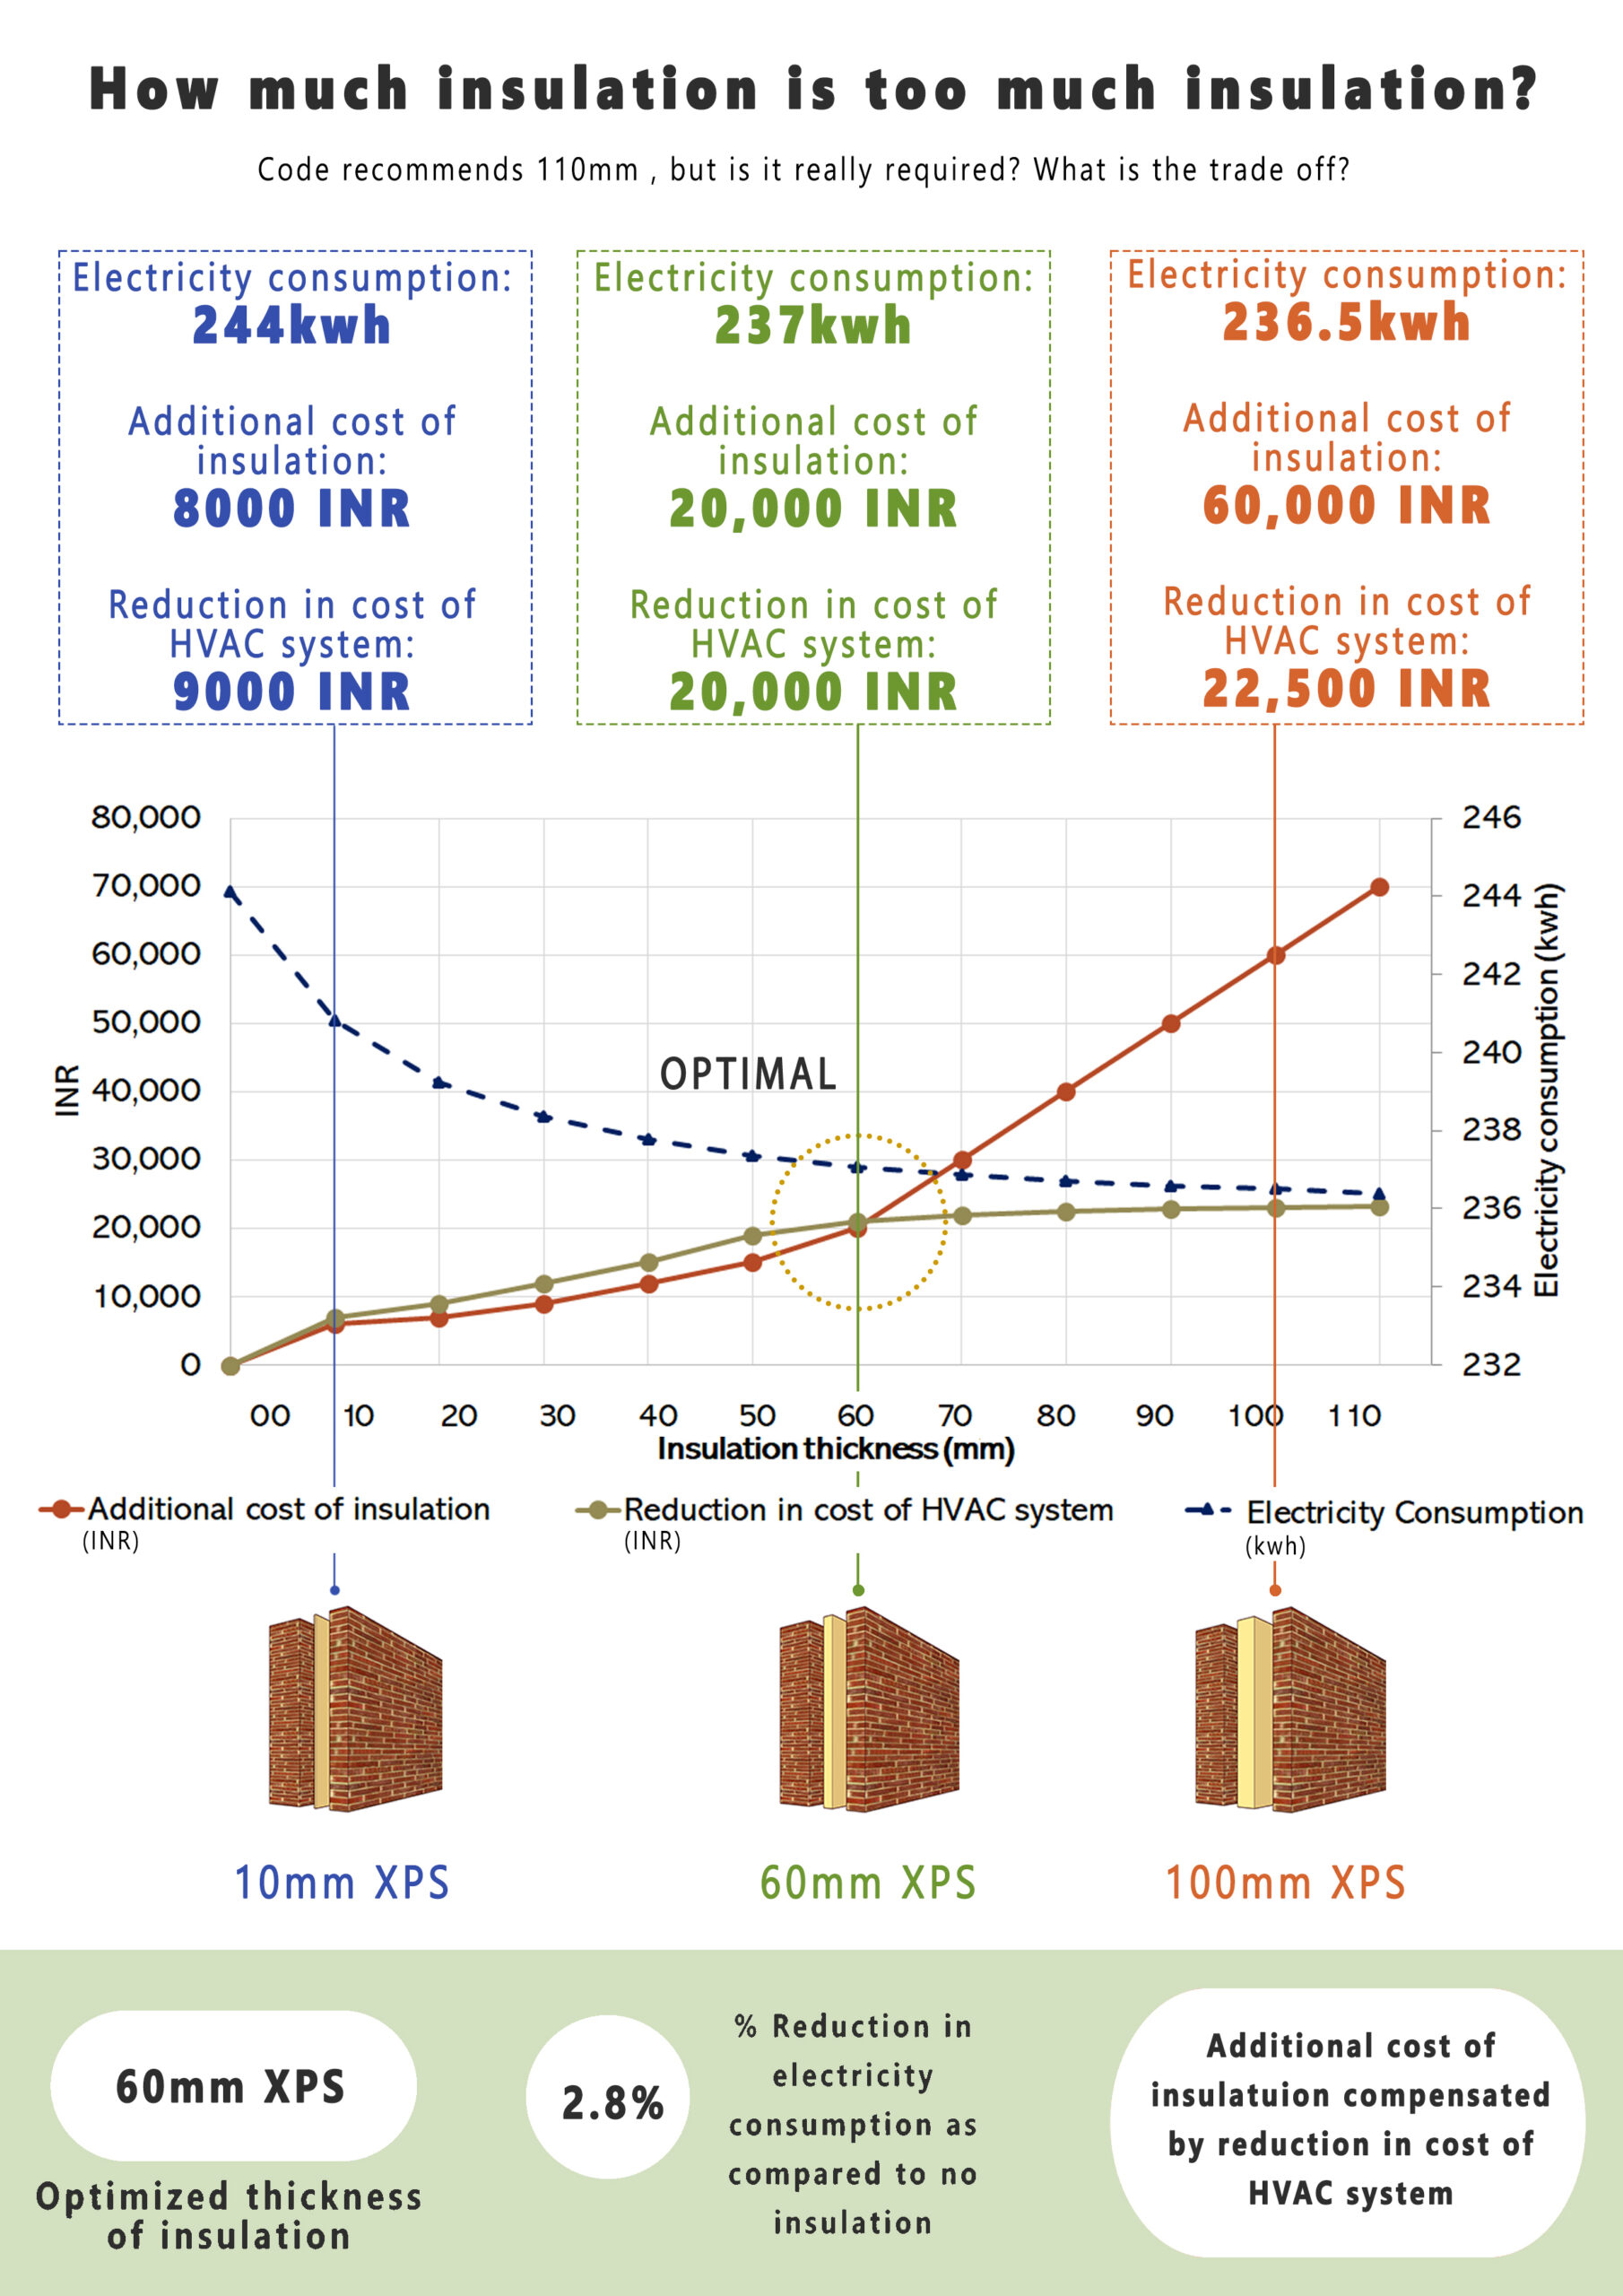
What is the impact of Insulation thickness on electricity consumption, reduction in HVAC system size and additional cost of insulation?
Submitted By: Siddhi Vashi
Submission Detail:The diagram presents a thorough analysis of how wall insulation thickness directly affects electricity consumption by lowering cooling loads. Additionally, it includes a cost-benefit analysis comparing the added cost of insulation to the reduction in HVAC system size resulting from decreased peak cooling loads. This not only leads to a reduction in operational costs but also yields savings in initial costs. The data shows that once the wall insulation thickness exceeds 60mm, the decrease in electricity consumption becomes marginal, while the cost of adding more insulation continues to rise. As a result, maintaining a wall insulation thickness of 60mm is deemed the optimal balance between cost-effectiveness and energy consumption savings.
Honorable Mention - Clarity
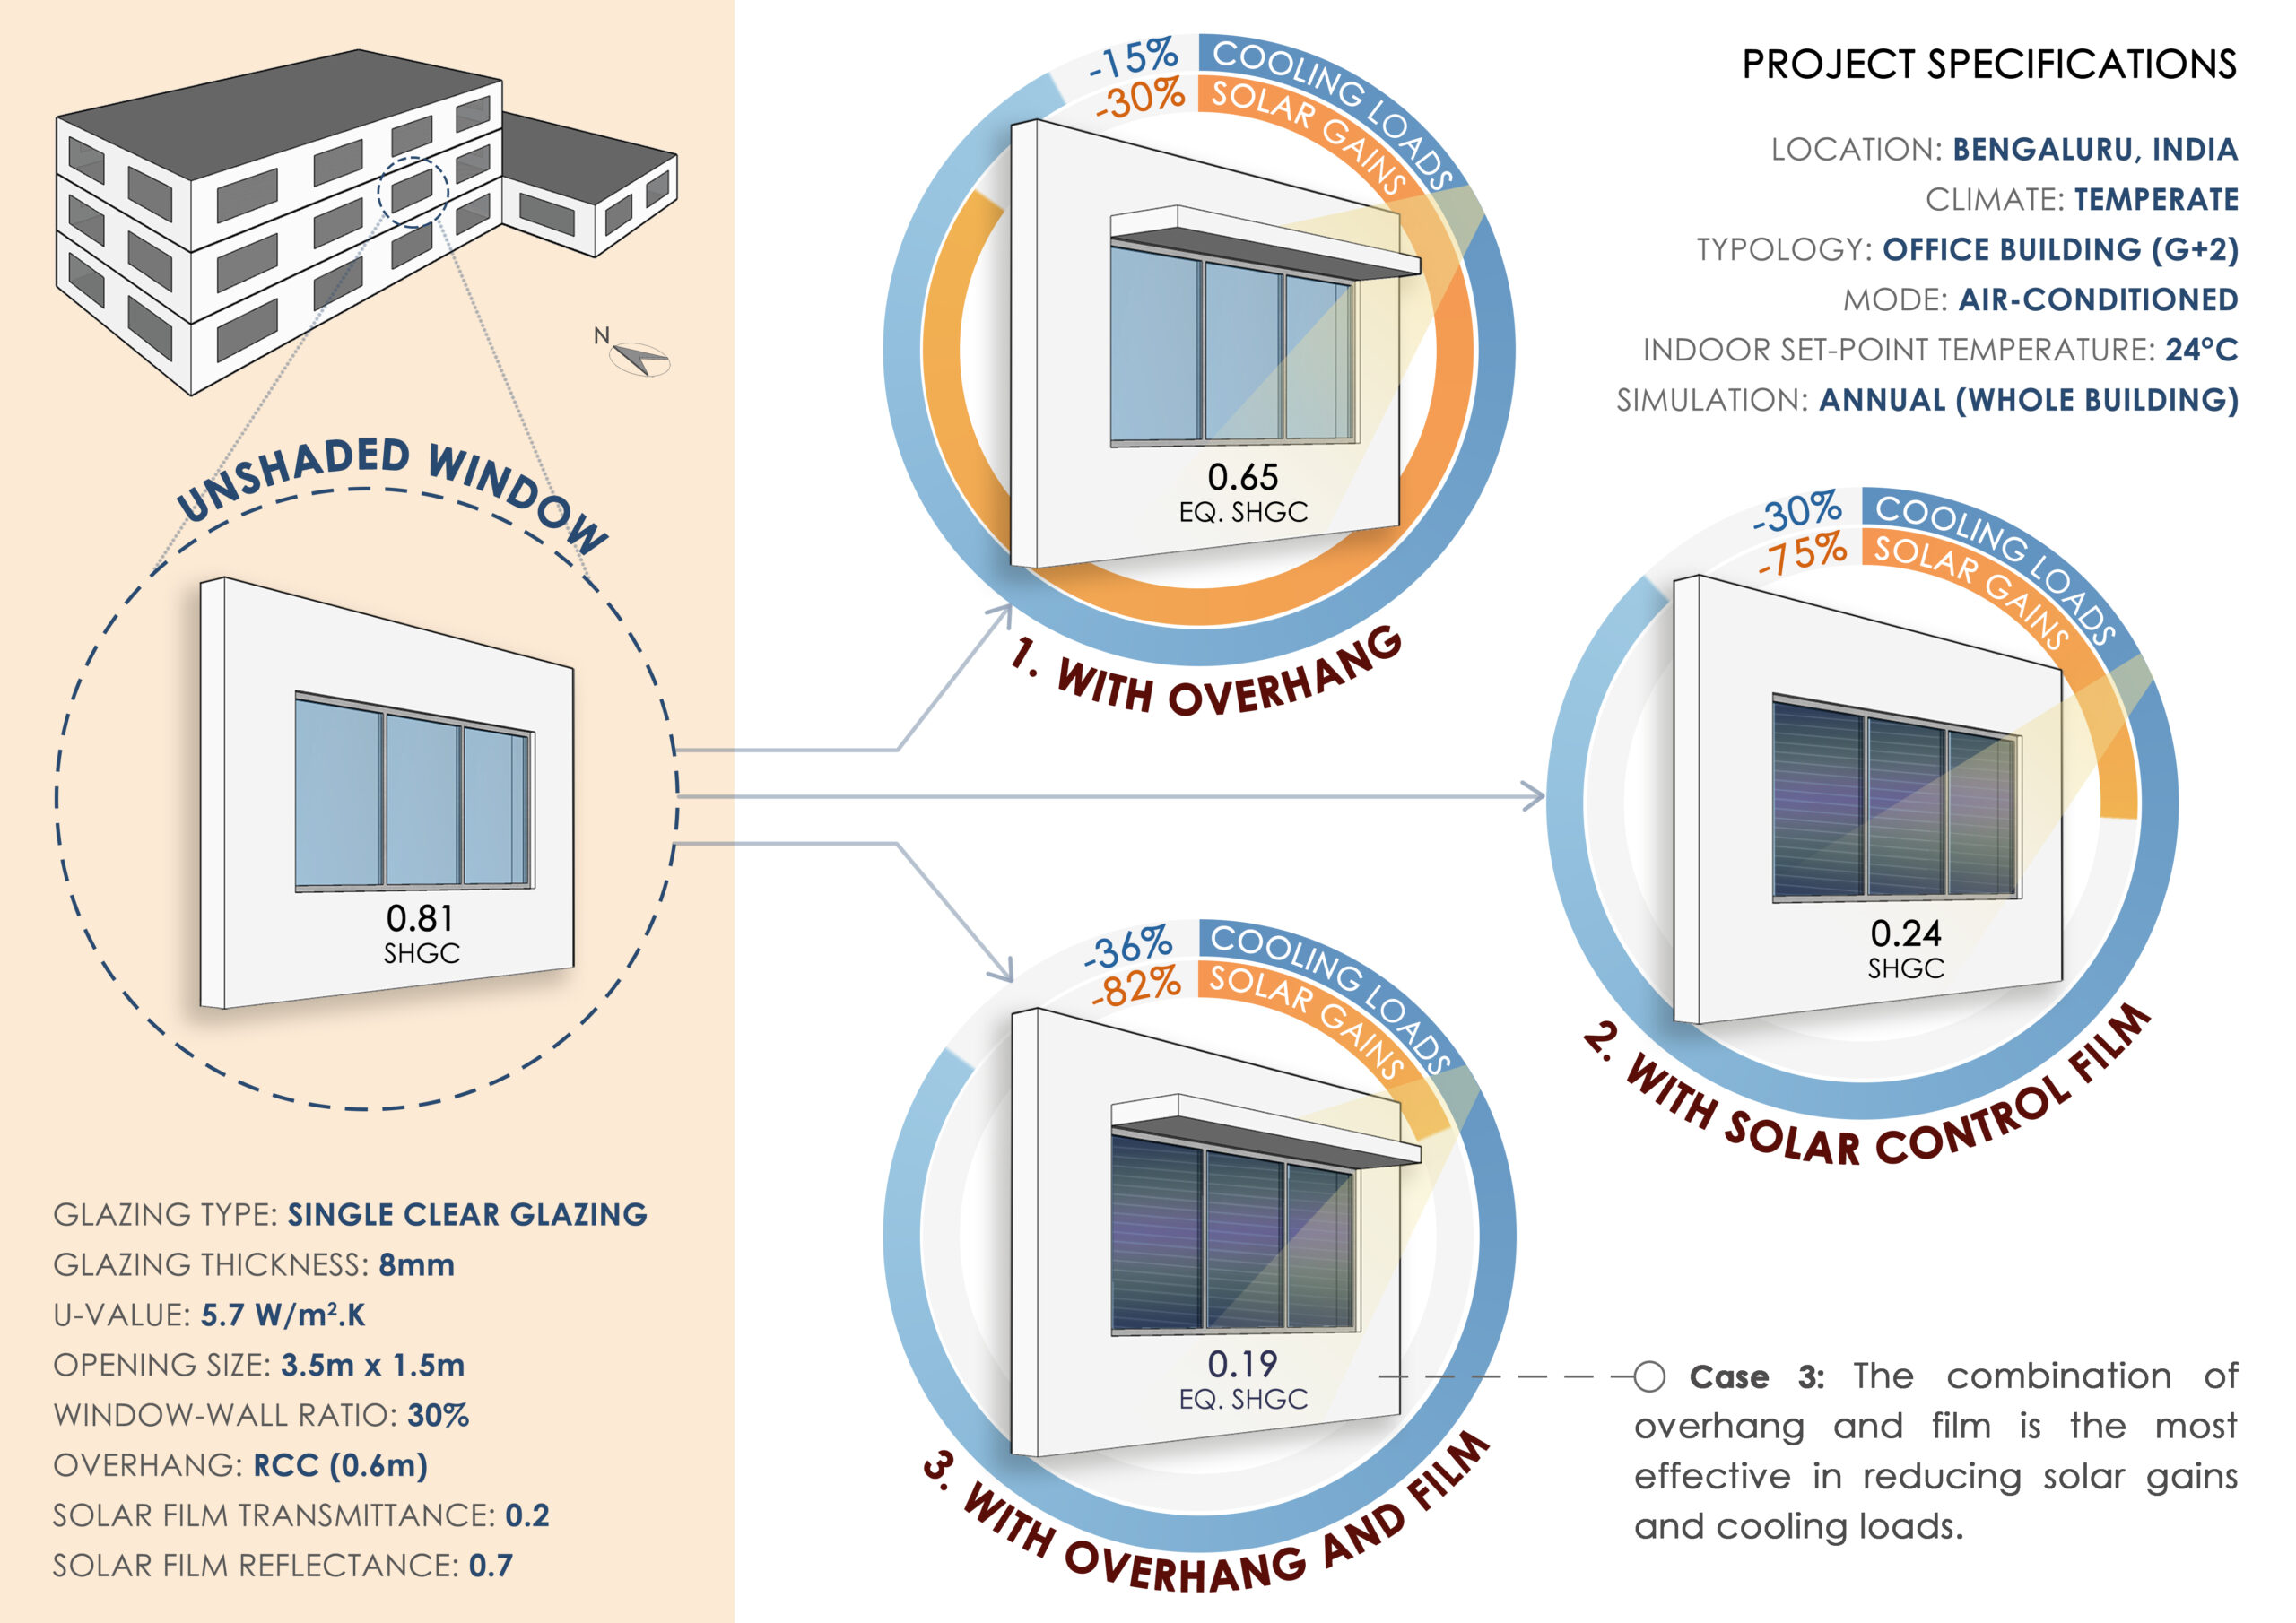
What is the impact of shading and solar films on radiative gains and cooling loads?
Submitted By: Deepashree K S
Submission Detail:This graphic shows the results of a simulation carried out to evaluate the reduction in solar gains through external glazing units and cooling loads with the addition of window overhangs and solar control films. Overhangs and SCFs contribute to the reduction in SHGC of the glazing unit. Radiative gains through windows reduce significantly with low SHGC glass.
Honorable Mention - Innovation
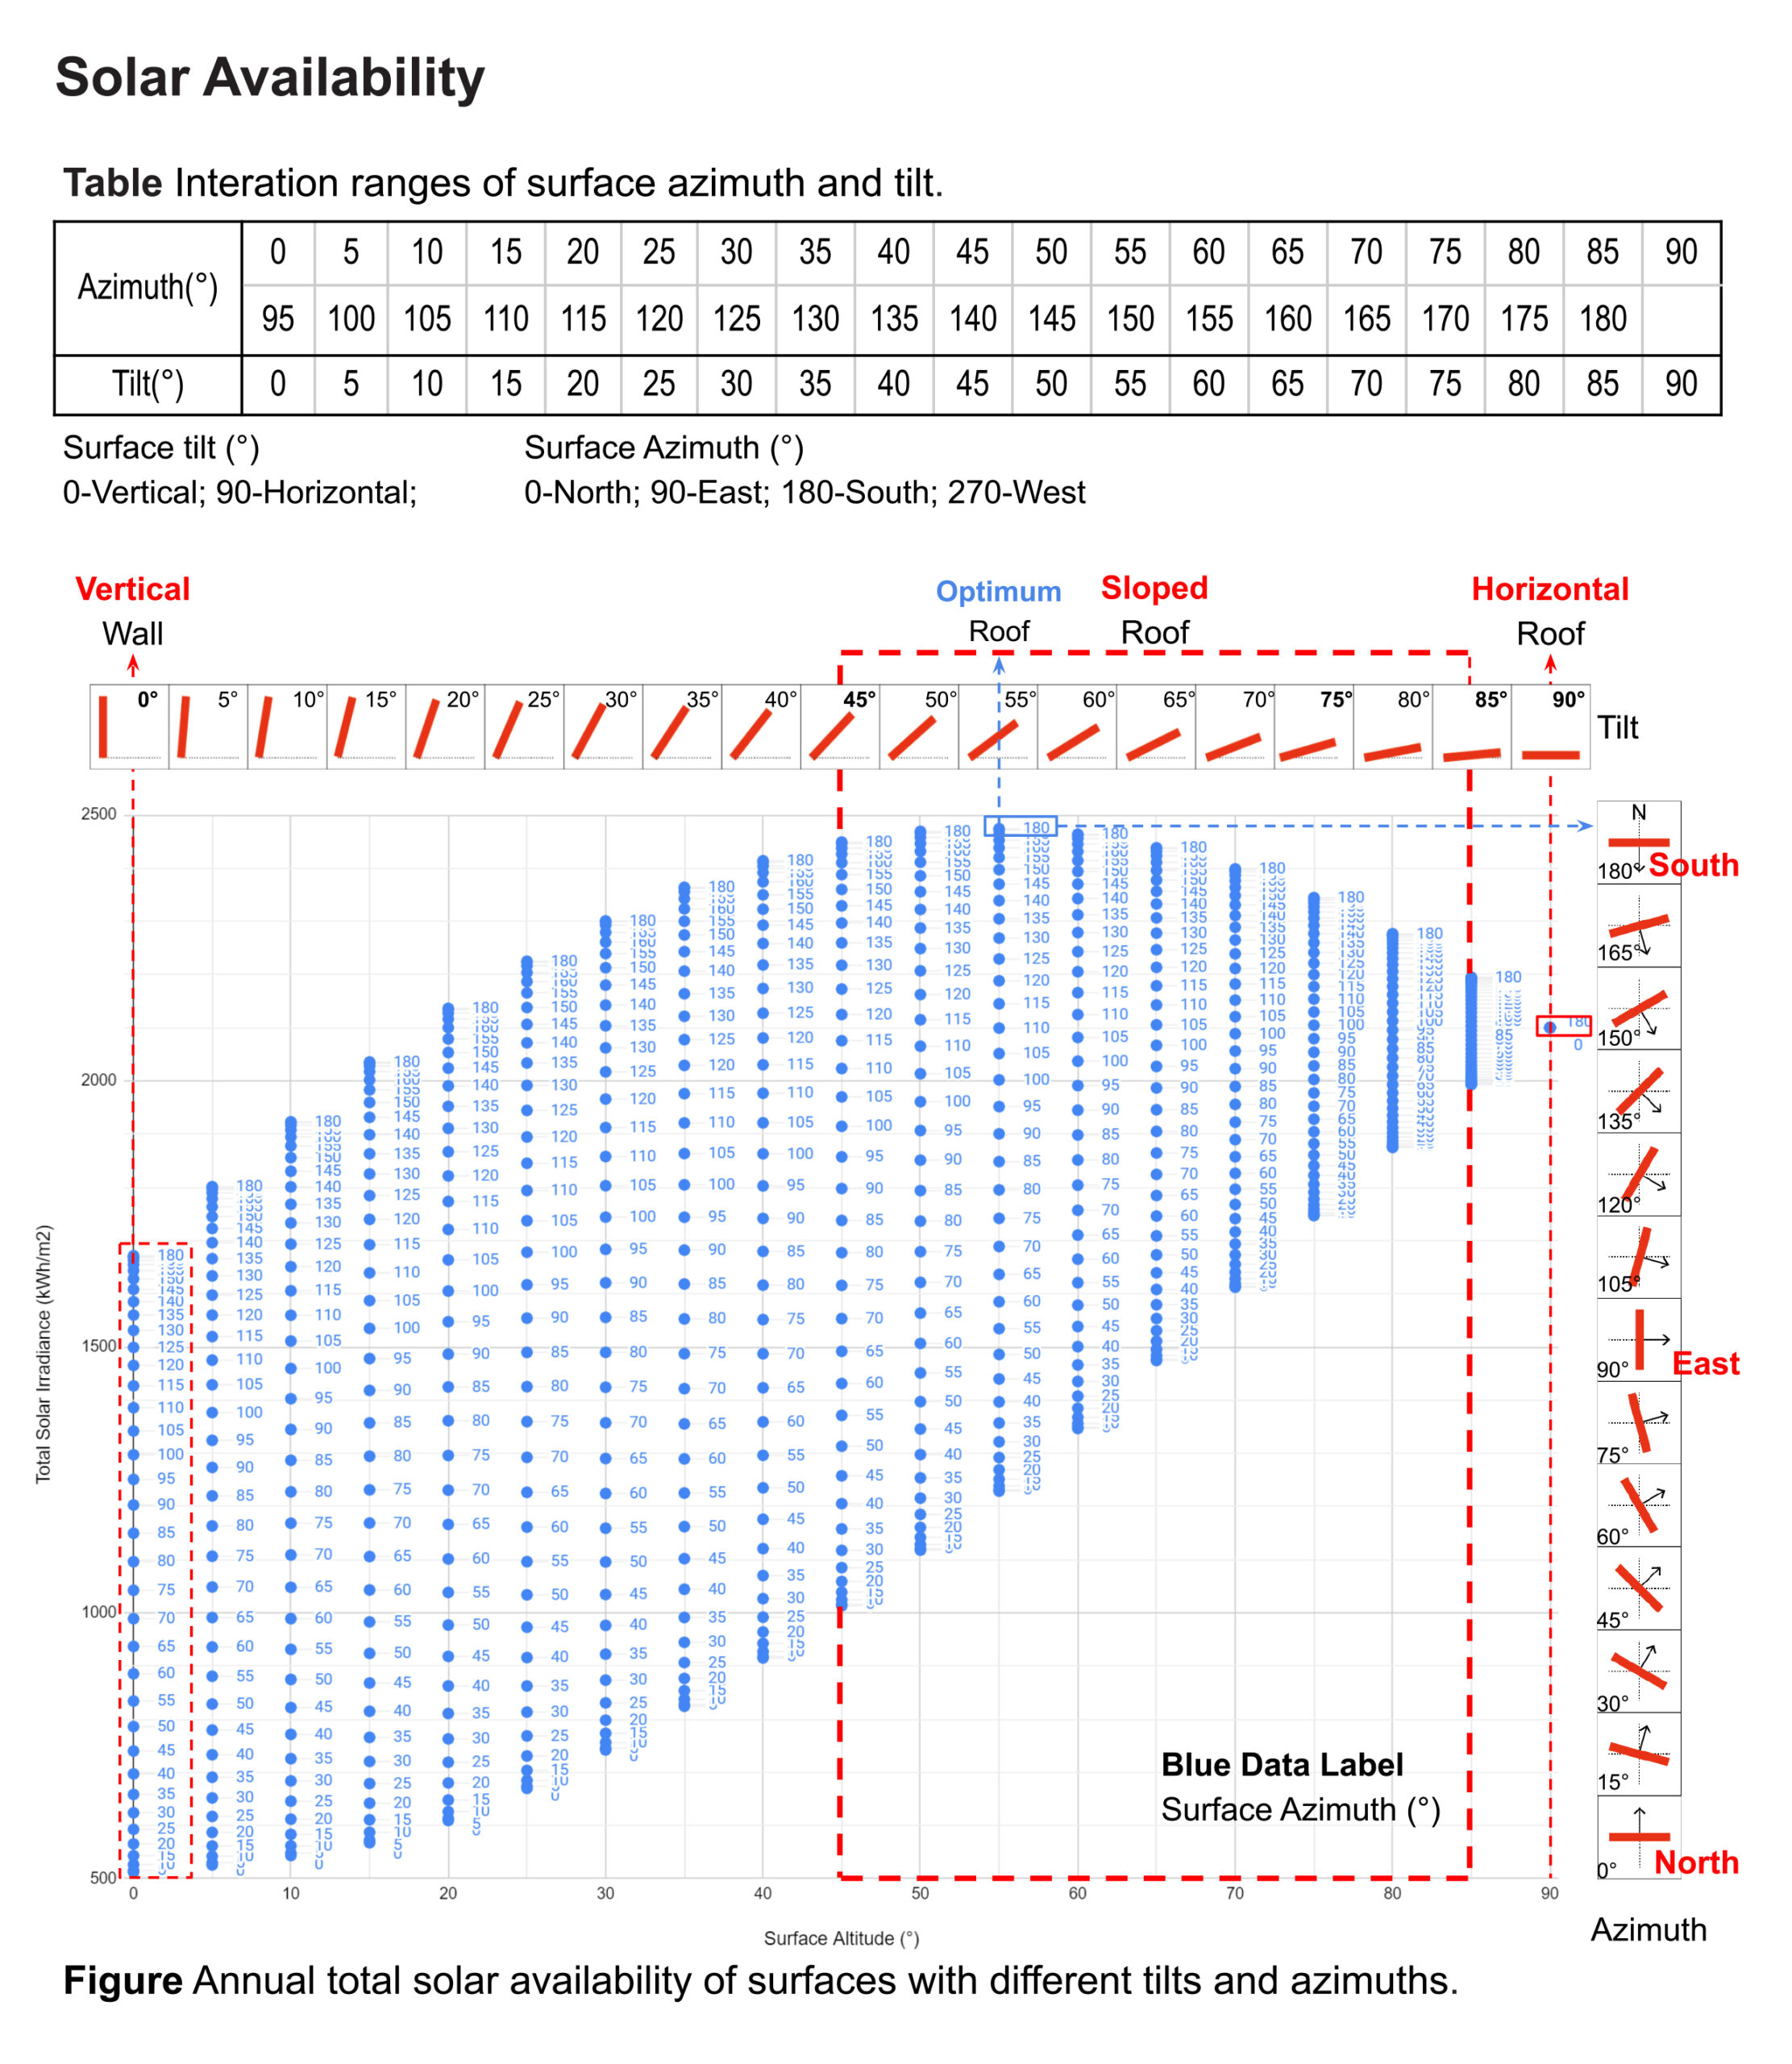
What is the impact of surface’s tilt and orientation on solar availability at 40 N?
Submitted By: Qi Zhang
Submission Detail: The chart illustrates the correlation between solar availability on surface with varying altitude and azimuth. Each data point represents a specific surface, detailing its altitude and azimuth, and the corresponding solar irradiance. The table provides the range of variation for azimuth and altitude. Take a close look, roofs (with altitude ranging from 0° to 90°) receive significantly more solar radiation than walls (at an altitude of 0°), with sloped roofs receiving even more than flat ones. The peak solar energy is attainable when the surface’s altitude is 55° and its azimuth is 180°.
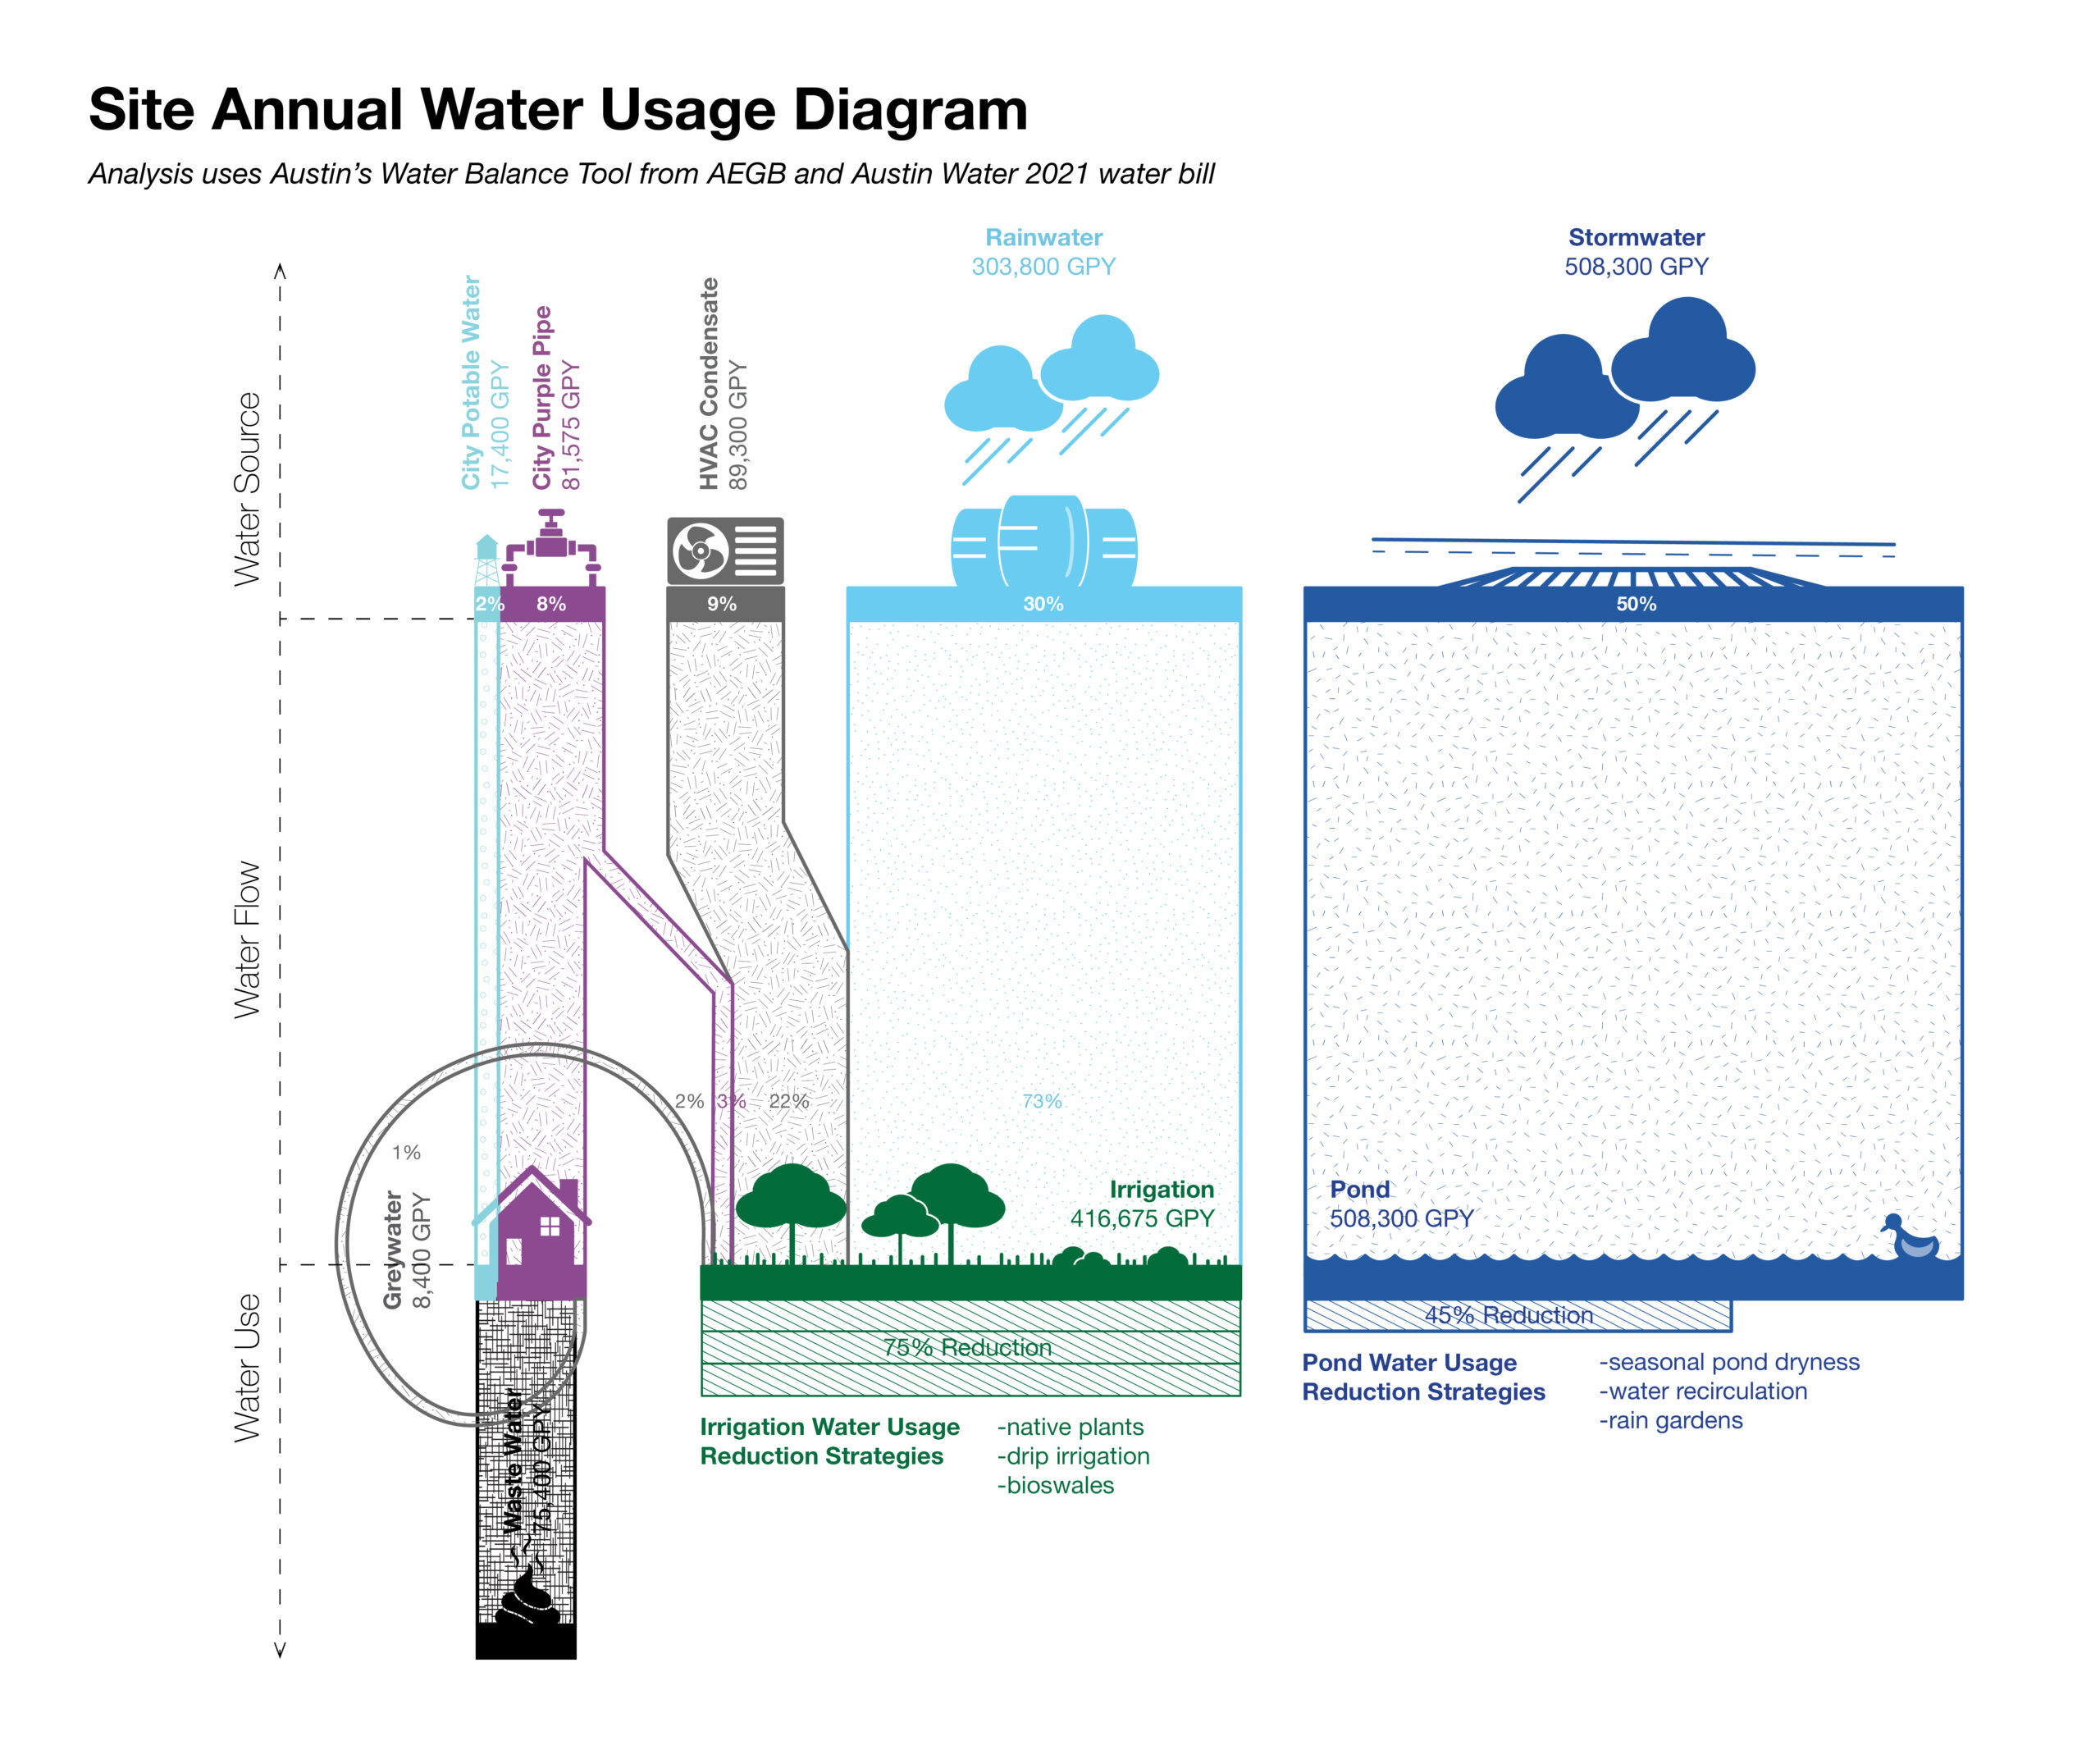
Honorable Mention - Aesthetic
What is the impact of alternate water sources and reduction strategies on the site’s total gallons of freshwater consumption?
Submitted By: Autusa Behroozi
Submission Detail: The graphic shows how water is used on the site during the course of a year. Considering the different water sources and water uses, it breaks down the amount of water flow from each source to the use.