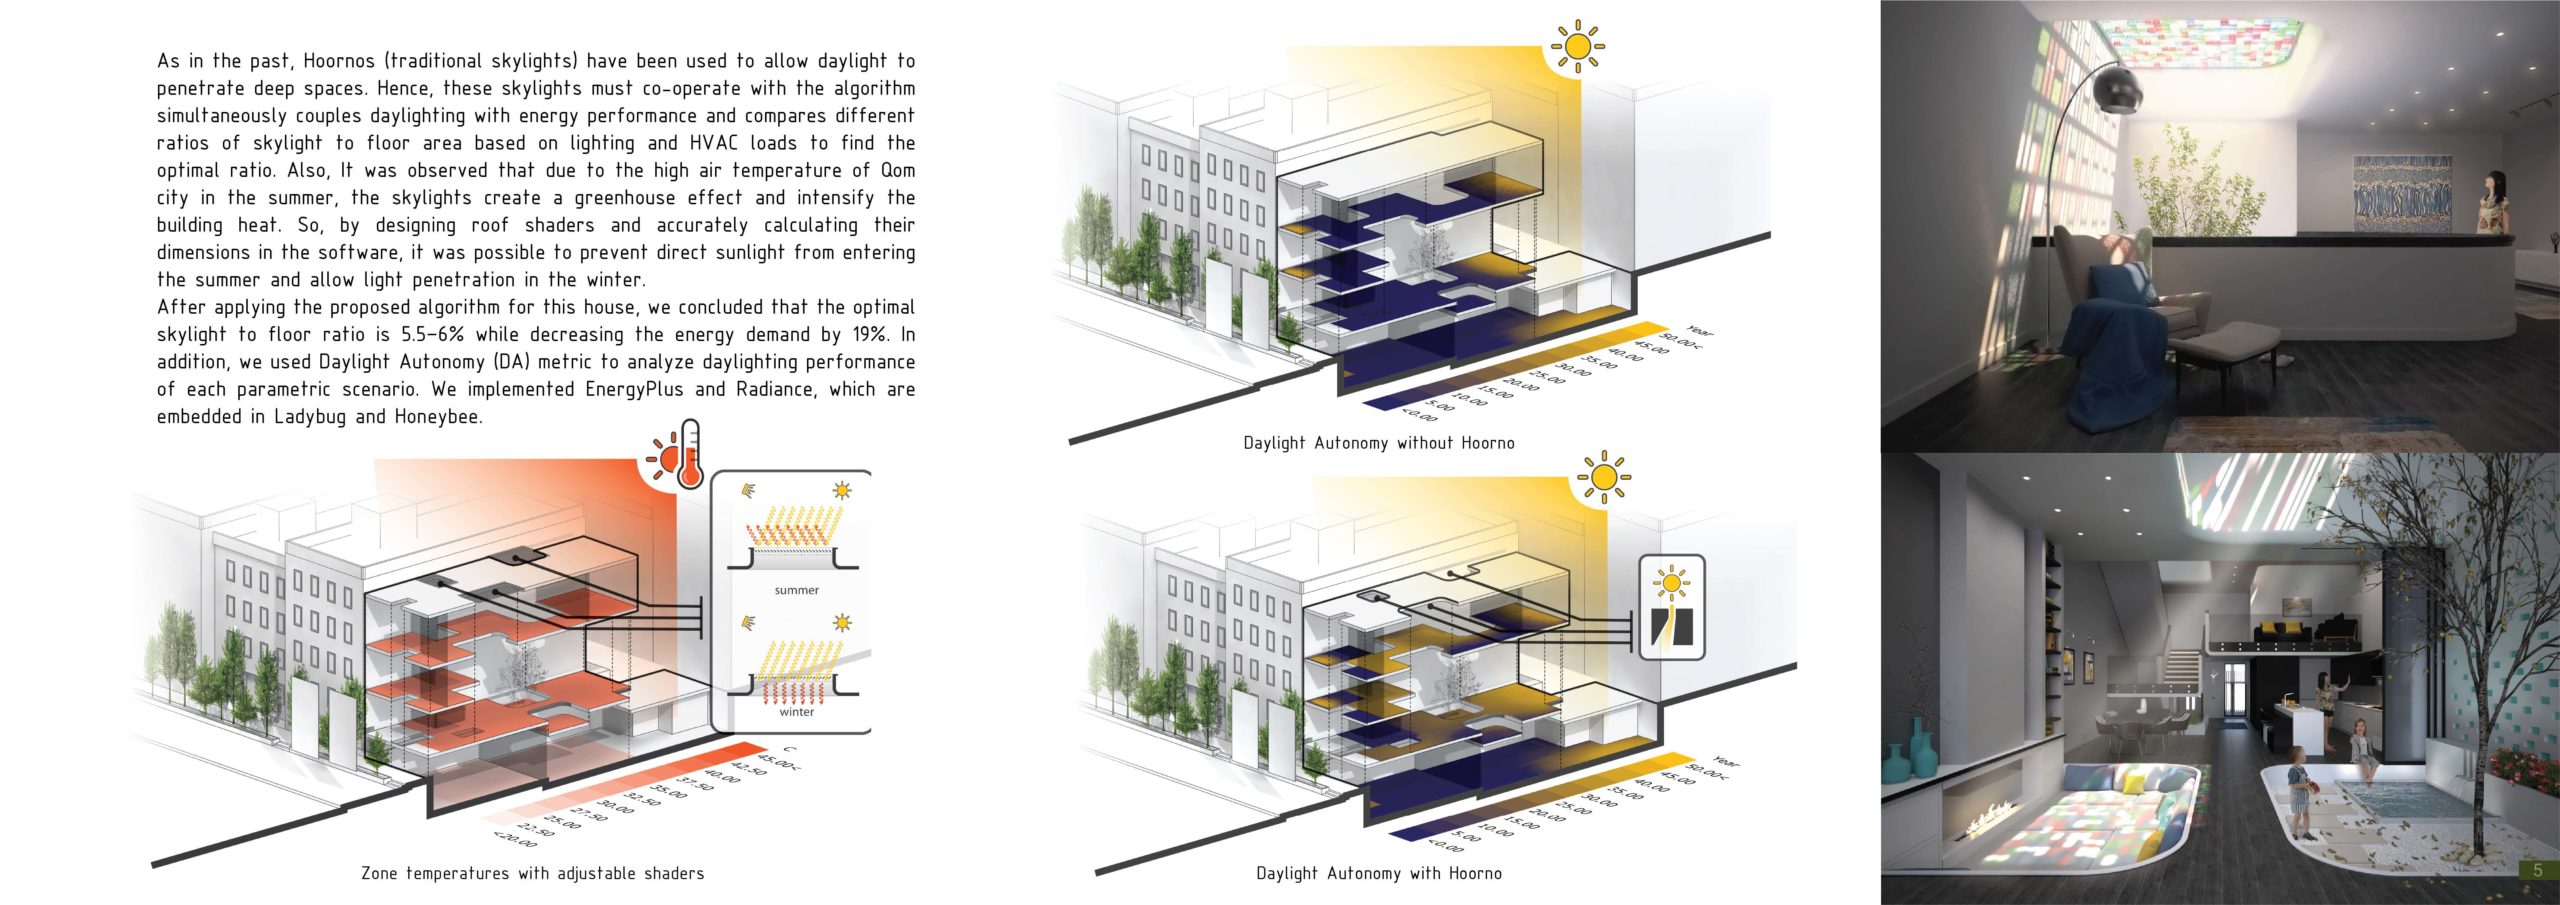
What is the impact of Skylight with Shader on Zone Daylight Autonomy and Temperature?

Project Location:
Simulation Scale:
Application:
Audience:
What is this graphic showing? Describe the different parts of the graphic and how it communicates the data.
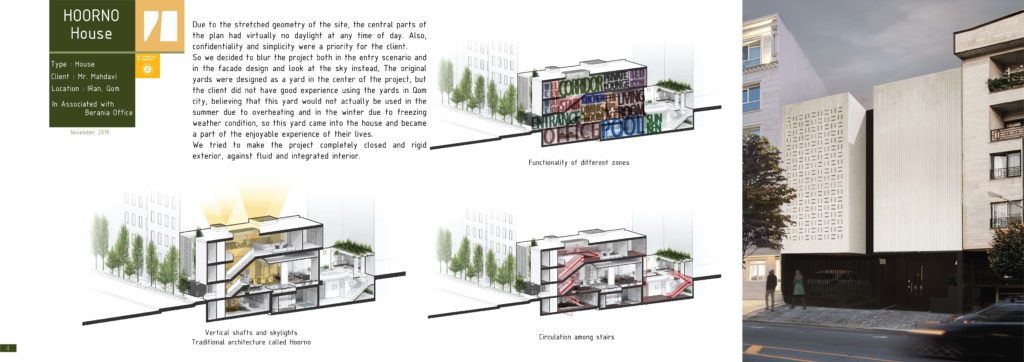
First project was looking toward a type of fenestration and the client didn't want side windows due to privacy and culture. Hence, we provided skylights in a three-floor house that supplies sufficient daylight through all floors. The climate condition in Qom, Iran made us to design appropriate louvers for skylights to control zone temperatures. Daylight autonomy was analyzed for this simulation and different ratios of skylight to floor area were compared based on daylighting and energy use intensity.
What type of graphic is this?
- Diagram
- Case Study / Multiple
- Analysis grid
Design Variables
- Glazing Fraction/Window to Wall ratio
- Other
- Passive strategies
- Renewable energy
- Window shading/sun control
Is this part of the ASHRAE-209 cycle?
- Prerequisites
What tools were used for the simulation analysis?
- Ladybug Tools
What tools did you use to create the graphic?
- Adobe Illustrator
- Adobe Photoshop
What was successful and/or unique about the graphic in how it communicates information?
This project needs to meet sufficient daylight in the depth of the first floor, so a combination of section-perspective could represent our solutions in a way where we locate the skylights and how the light penetrates through them into the floors.
Is there anything else you would like to mention?
Supplementary Graphics
Included in the competition:
Daylighting and Glare with Side Lighting
July 15, 2021-September 20, 2021


