What is the impact of orientation on daylight performance and irradiation on the façade? (Competition Winner)

Project Location:
Simulation Scale:
Application:
Audience:
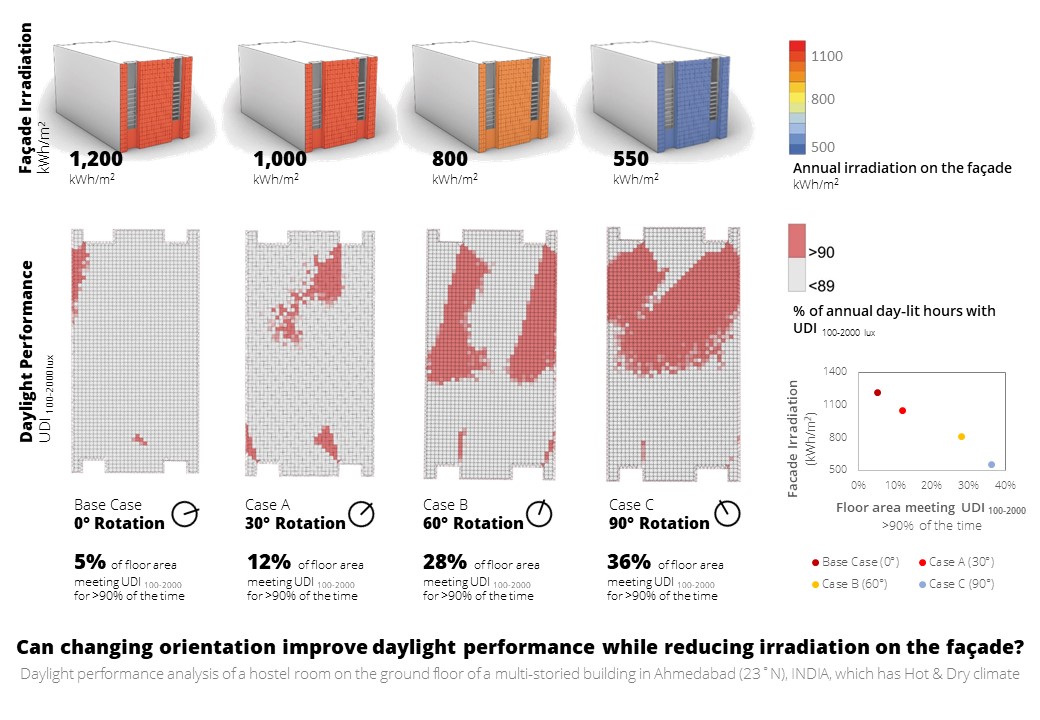
What is this graphic showing? Describe the different parts of the graphic and how it communicates the data.
The graphic attempts to show the relationship between daylight performance and the irradiation on the façade. Change in orientation was found to impact both of these performance measures in a desirable manner and thus appears like a conducive design strategy in the given climate.
What type of graphic is this?
- Analysis grid
- Case Study / Multiple
Design Variables
- Building Massing
- Other
- Passive strategies
What tools were used for the simulation analysis?
- Excel
- Ladybug Tools
What tools did you use to create the graphic?
- Adobe Photoshop
- Excel
- Grasshopper/Rhino
- PowerPoint
What was successful and/or unique about the graphic in how it communicates information?
A clear relationship was found between the daylight performance and irradiation of the façade and is easily understood as there is a clear linear arrangement of data. This exploration was to understand the potential conflict in trying to avoid direct solar radiation as much as possible in a hot and dry climate but also maintain minimum acceptable daylight levels.
Is there anything else you would like to mention?
This analysis was done as a part of the classroom exercise under master's in Building Energy Performance at CEPT University, Ahmedabad, India, under the guidance of Professor Minu Agarwal Ph.D. in conjunction with alumni Mili Jain.
Included in the competition:
Daylighting and Glare with Side Lighting
July 15, 2021-September 20, 2021

