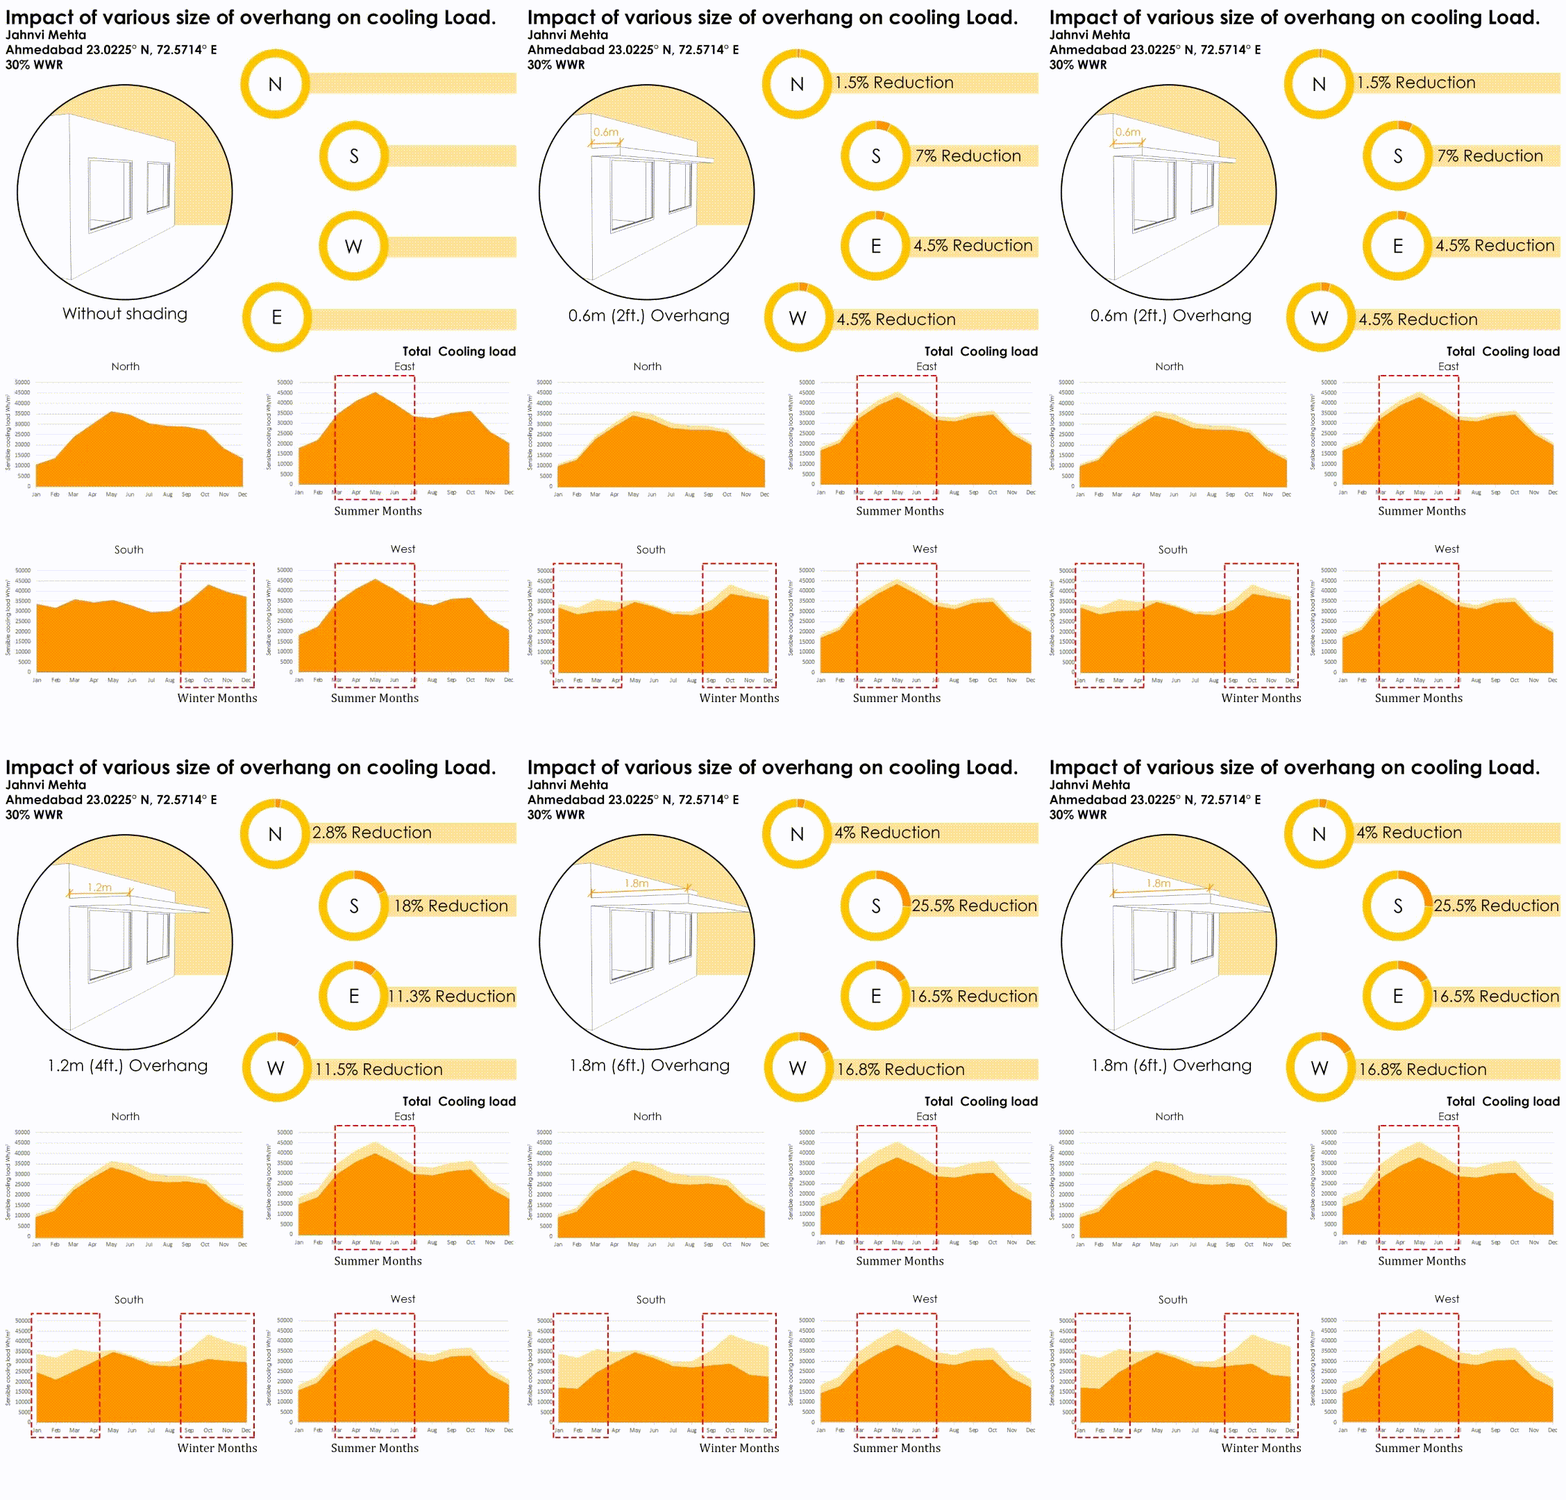
What is the impact of overhang size and orientation on Cooling Loads?

Project Location:
Simulation Scale:
Application:
Audience:
What is this graphic showing? Describe the different parts of the graphic and how it communicates the data.
The graphic demonstrates the change in cooling loads of a space with the increasing size of overhangs for various orientations.
What type of graphic is this?
- Animated gif
Design Variables
- Building Massing
- Window shading/sun control
Is this part of the ASHRAE-209 cycle?
- Cycle 1 Simple Box Model
What tools were used for the simulation analysis?
- Design Builder
- Excel
What tools did you use to create the graphic?
- Adobe Photoshop
- Excel
What was successful and/or unique about the graphic in how it communicates information?
At the same time one can compare the impact of selected overhang size for different orientation and overall reduction.
Is there anything else you would like to mention?
