How does monitoring the performance of a Living Building help evaluate design, building response to climate, and occupant behavior?
University of Washington Integrated Design Lab
Project Information
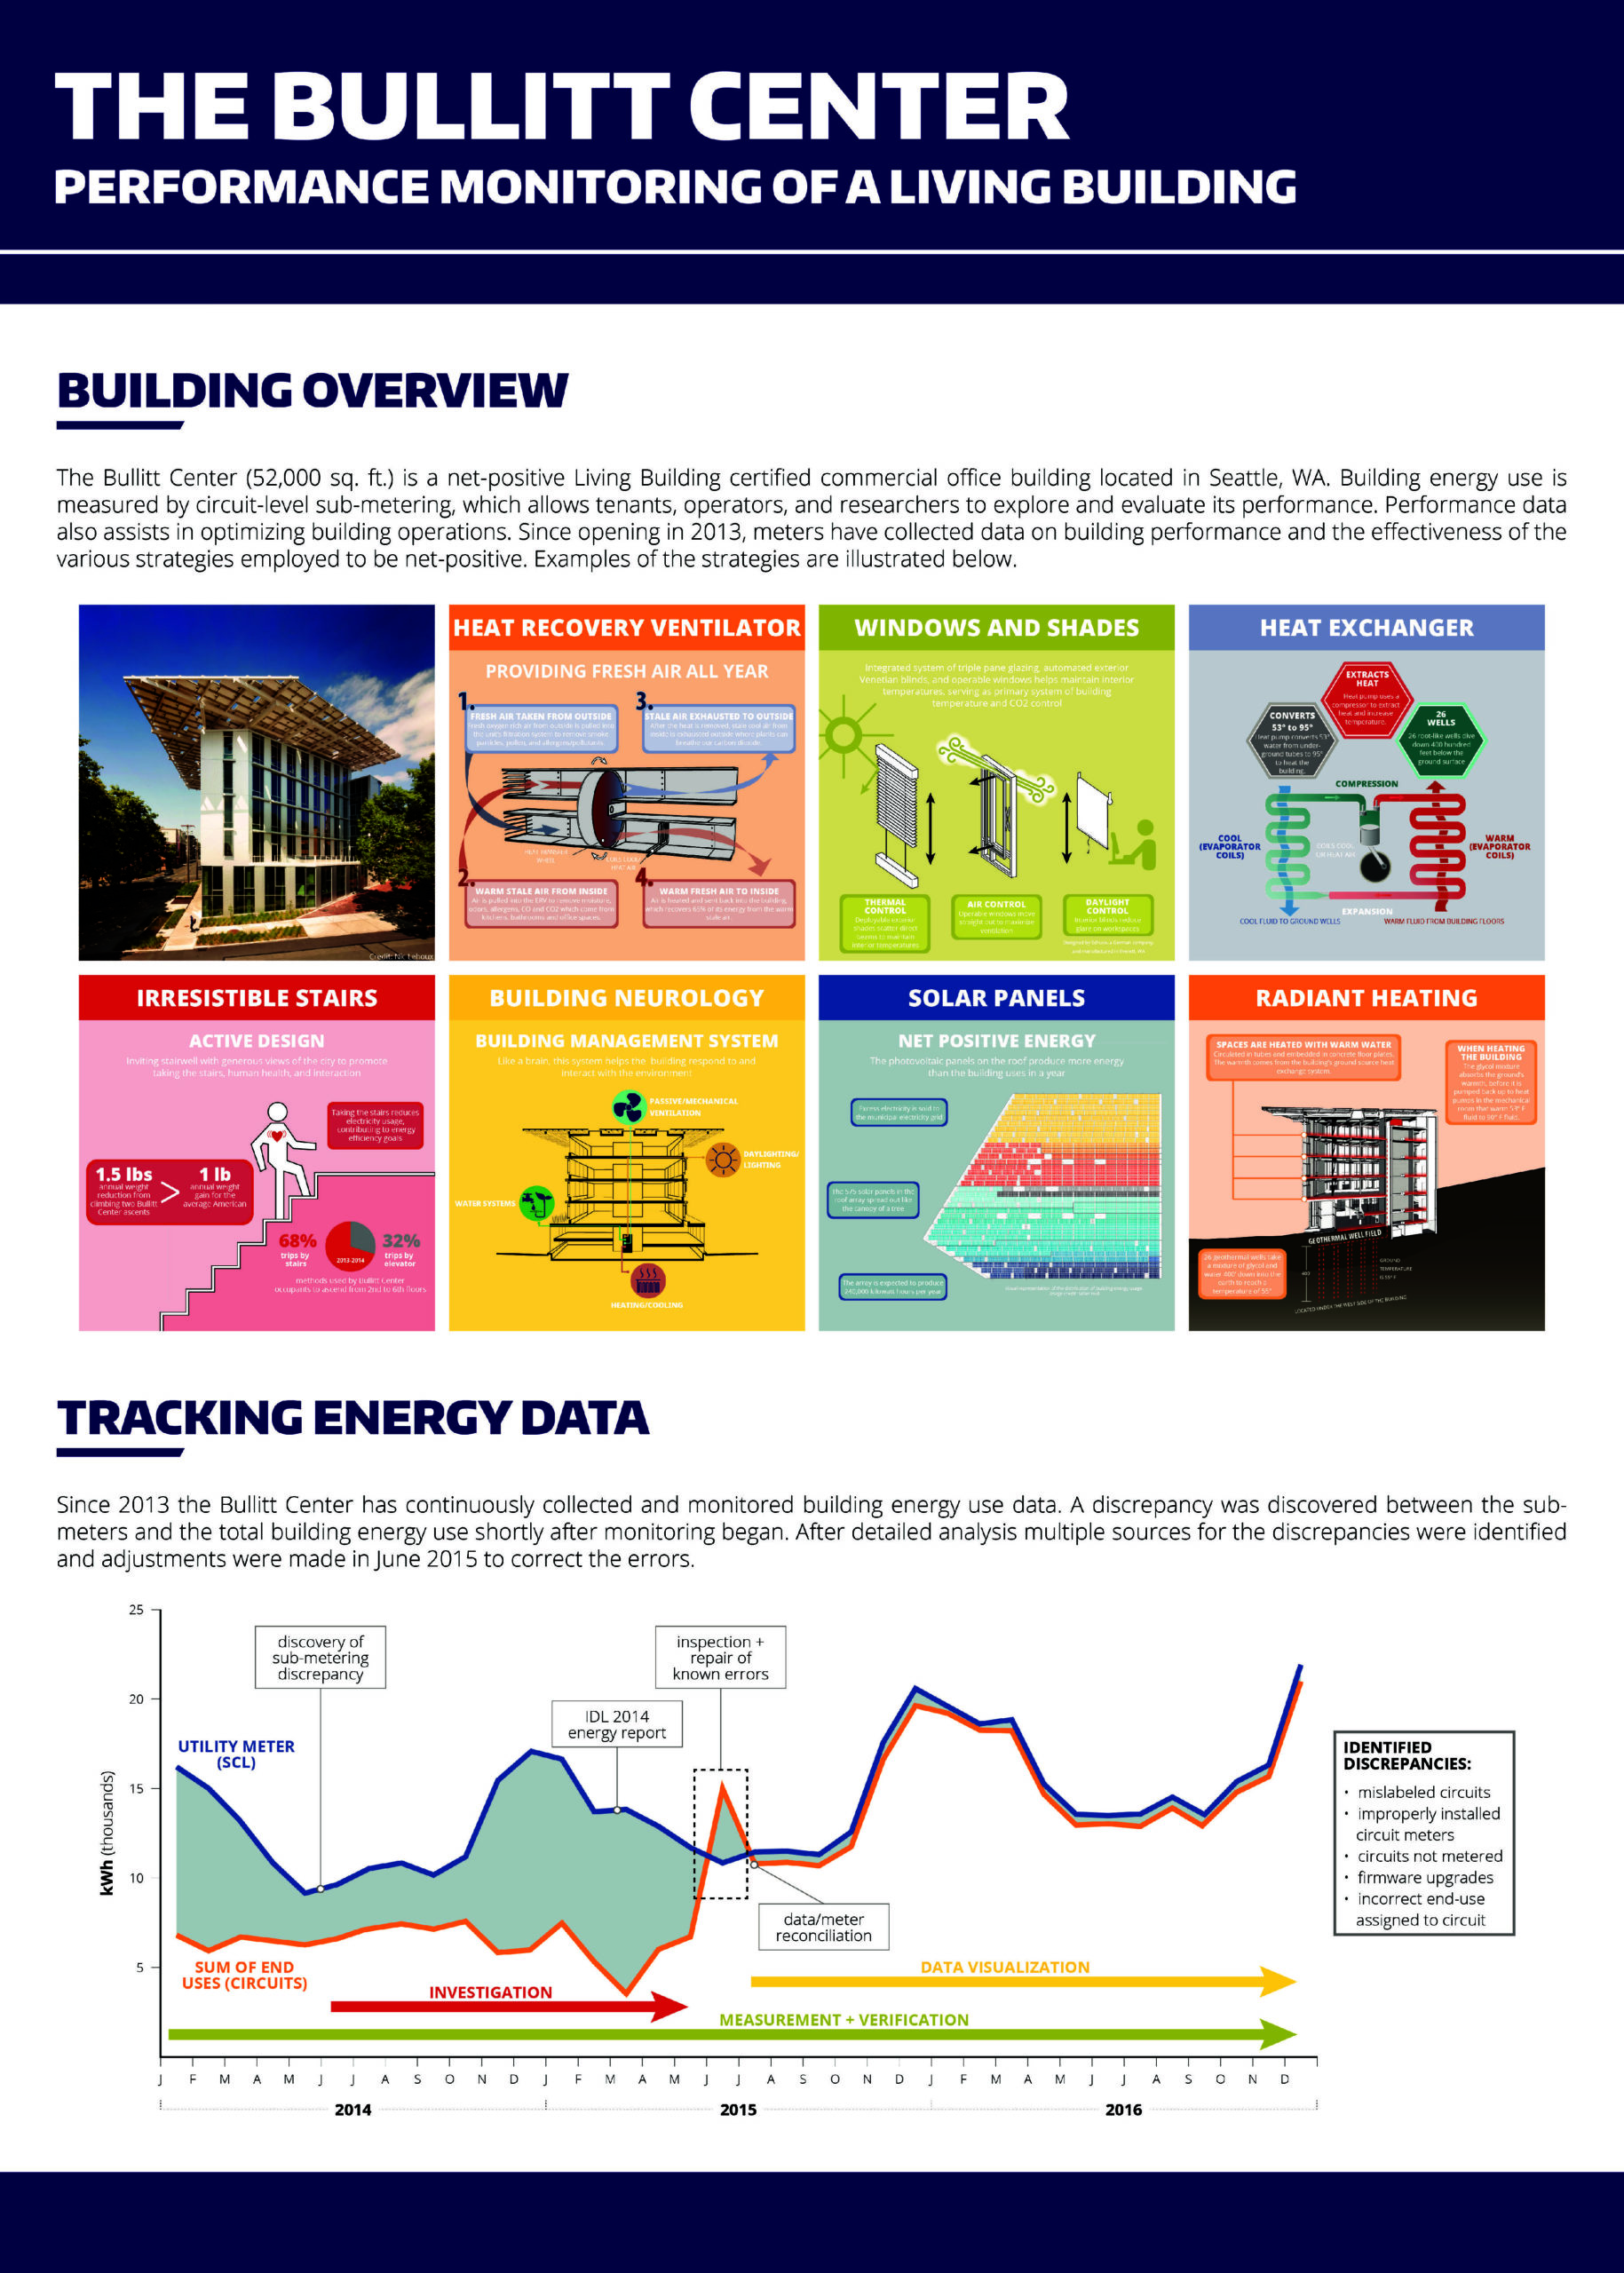
Since 2013 the Bullitt Center, a net-positive Living Building Certified commercial office building, has been continuously monitored in order to collect a wide range of data points by the University of Washington Integrated Design Lab. This includes data collected from a variety of sensors in order to understand energy use (by floor, end-use), energy generation, climate/weather data, and automated window operation.
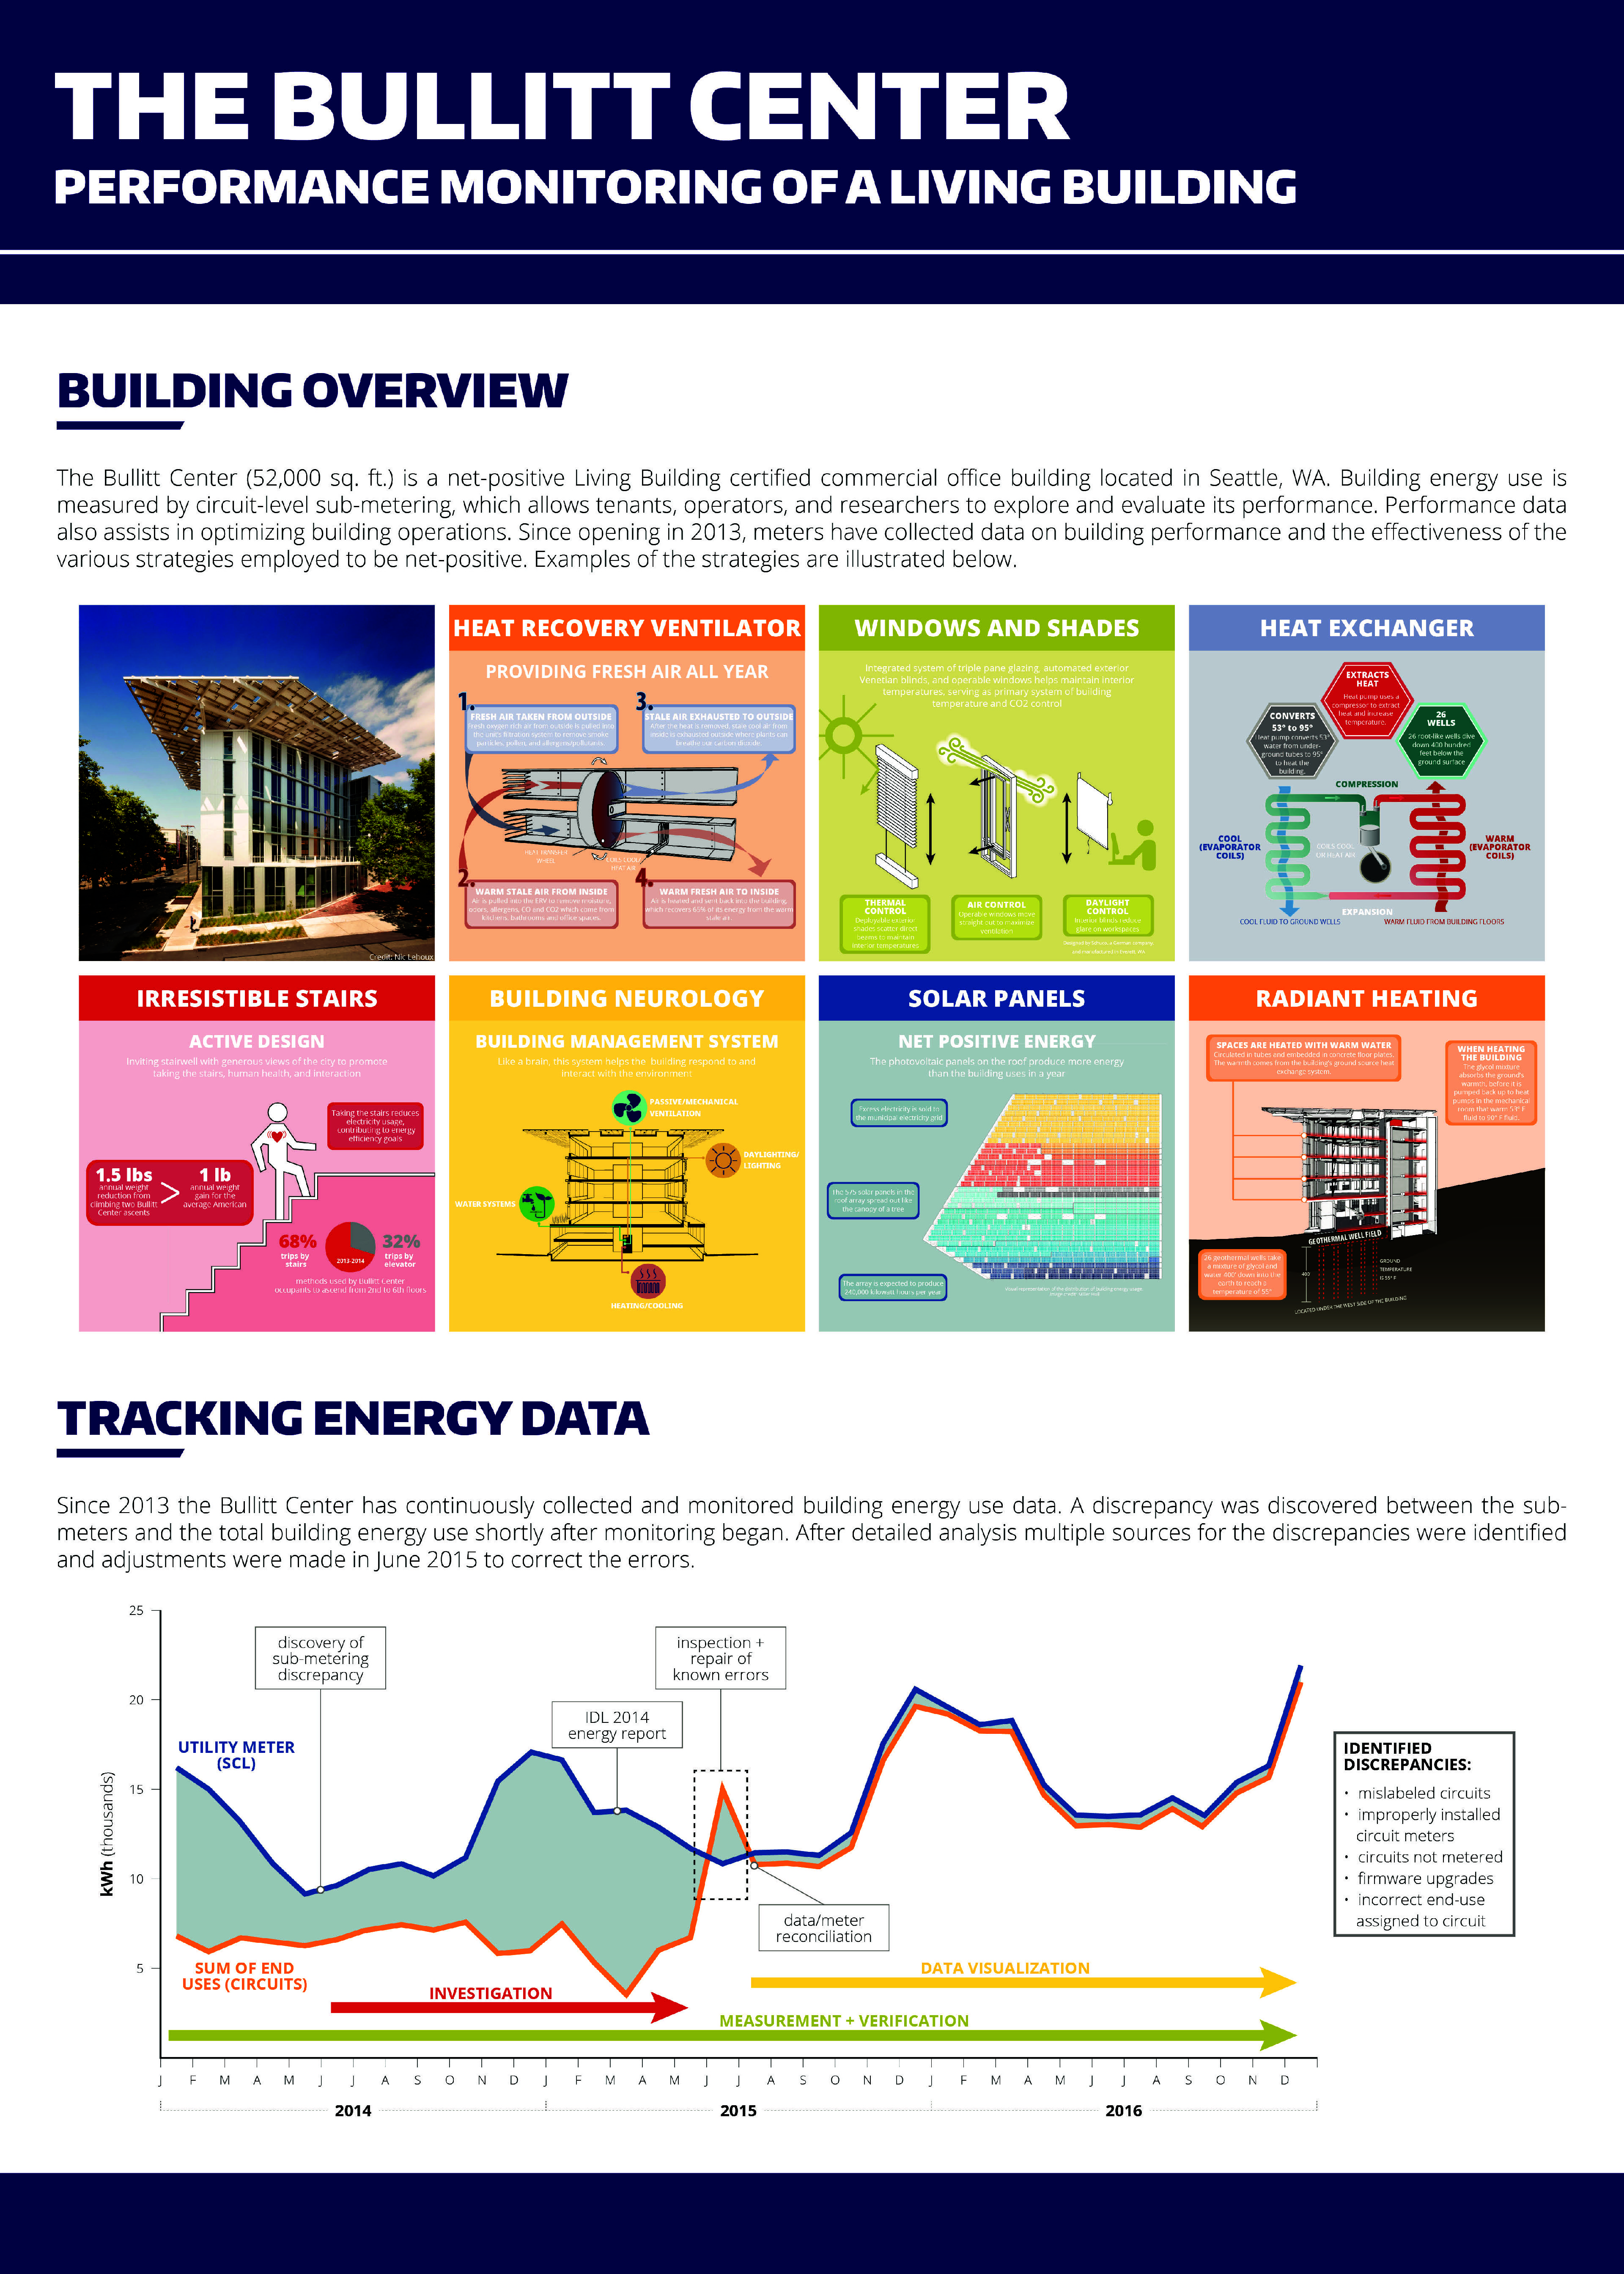
This project produced a wide range of outputs that were used to understand the building, evaluate the success of design strategies, and grasp/make changes to occupant behavior. Outputs were originally used to calibrate monitored data by eliminating a discrepancy between sub-meters and total building energy use. The outputs of this project are energy use (by floor, end-use), energy generation, climate/weather, and automated window operation.
52,000
4C
98122
- Office
SIMULATION PROCESS SECTION
How does a Living Building Certified project perform over time? What is the impact of occupant behavior on building performance? What are some best practices for monitoring a building? How do energy end uses change by month, floor, and tenant? What portion of the total building EUI is composed of lighting, plug, plumbing, HVAC, IT, and elevator loads? How does plug load usage change throughout the day and by floor? How does the number of people and computers per floor correlate to kWh per person? How does lighting and plug loads break down per floor? How does outside air temperature correlate with hourly energy use? How does automated window operation change by temperature/by month?
- Architect - Intern
- University
- Rhino - DIVA
- Post Occupancy
This project was a part of a continuous post-occupancy evaluation and therefore simulation did not integrate directly into the design process. The Bullitt Center, in many ways, is an experimental building that utilizes a wide variety of highly sustainable techniques. Monitoring the building is meant to aid in evaluating the effectiveness of systems, assist in the decision making process when making building adjustments, and to help inform the design of new projects. NOTE: The required field "What tools were used for the simulation analysis?" did not include the options of Tableau or Excel, which were the methods used. Diva was used by the initial design team in order to make design decisions. This project examined the actual building's performance in a post-occupancy analysis.
The Bullitt Center is constantly monitored through an array of sensors and weather stations. This in essence provides a live simulation of the buildings energy use (by floor, end use), energy collection, climate, and automated window operation. This data was analyzed using Tableau, which in turn was used to begin creating graphics. These data visualizations were then adjusted and enhanced using Adobe Creative Suite and Rhinoceros software. In certain situations, Microsoft Excel was also used to generate simple graphs that were then adjusted in illustrator.
The results of the data analysis were visualized using a combination of Tableau, Microsoft Excel, Adobe Creative Suite, and Rhinoceros. These were then combined into a series of posters that represent the main element of this submission. The posters provide information on a wide range of data collection, combine useful information, and use a series of easy-to-read visualizations. The graphics were successful because of the visual clarity, connection between images, usage of icons/color, and simplification of expression. In the end, conclusions pertaining to the data are easily made because of the clarity of the data visualizations.
This project is an analysis of post-occupancy data that used visualizations in order to understand the energy performance of a unique building. This is the tail end of a process that began with simulation to inform design decisions in order to achieve a set of rigorous performance goals and the graphics in the submission explore how the building is actually performing. A next step would be to explore how this data and graphics can inform the assumptions of future simulations.