What are the impacts of key building parameters on the net-positive behavior, robustness and marketability of the Georgia Tech Living Building?
Smart Campus Initiative Group Aerospace Systems Design Lab (ASDL) Georgia Institute of Technology (in collaboration with HPBL)
Xiaoshu Fei (ASDL), Joshua Brooks (ASDL), Dr. Scott Duncan (ASDL) Prof. Dimitri N. Mavris (ASDL)
Project Information
Building envelope, HVAC system, appliances, occupancy, plug loads, lighting load, schedules, orientation, climate file (8760 format), cistern and solar PV sizes
Building EUI, energy consumption, water consumption (by end-use)
37,000 sq ft
3B
30332
- Education
SIMULATION PROCESS SECTION
How do various building envelope features, mechanical system choices, and behavioral / occupancy parameters affect energy and water demand? What should be focused on? Could this building, as built, be net-positive if it were in a different location? If not, what design changes are needed? Will this building continue to meet net-positive energy and water requirements in the year 2050 based on different climate scenarios? What size PV system ensures a net-positive energy behavior for a Living Building and by what margin? Can methodology and tool be applied for similar future building analysis and design?
- University
- Design Builder + Eplus
- Design Development
- Construction Documentation
- Post Occupancy
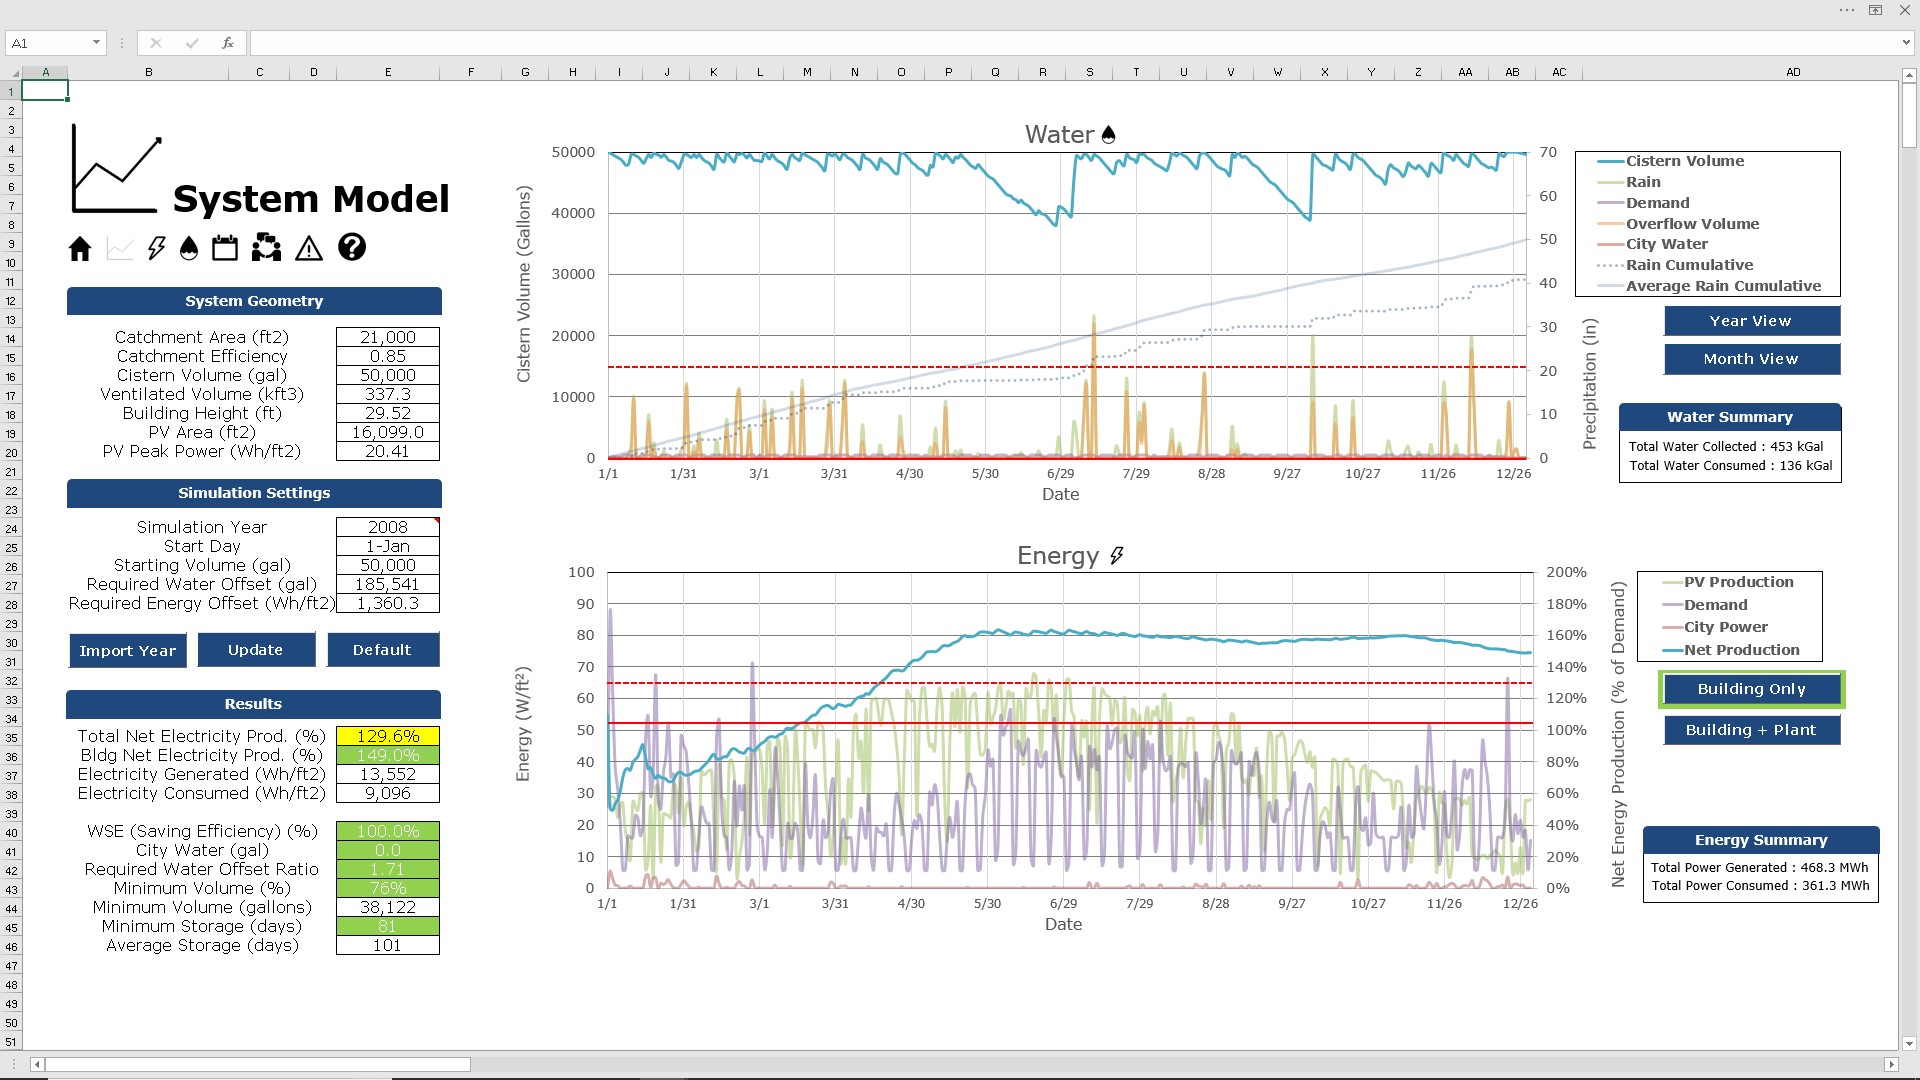
The simulation process was driven by an overarching goal to ensure compliance with the Living Building standard. Numerous construction design decisions were made earlier on during a first round of building simulations to see how the building consumption stacks up to similar buildings; this included exploring the mix of different environmental and HVAC systems. We ran cases for building operation and usage in terms of plug loads, occupancy and event impacts, lighting, schedule and temperature setpoints to see how building consumption affected the net positive behavior of the building. In addition, extensive cloud conditions and drought conditions were simulated in order to further glean insight into building behavior. At all times, the margin by which the building remained net positive as tallied annually was considered. (NOTE: Designbuilder + EnergyPlus was used but prior to that two custom tools developed at Georgia Tech were used: EPC and WEPC).
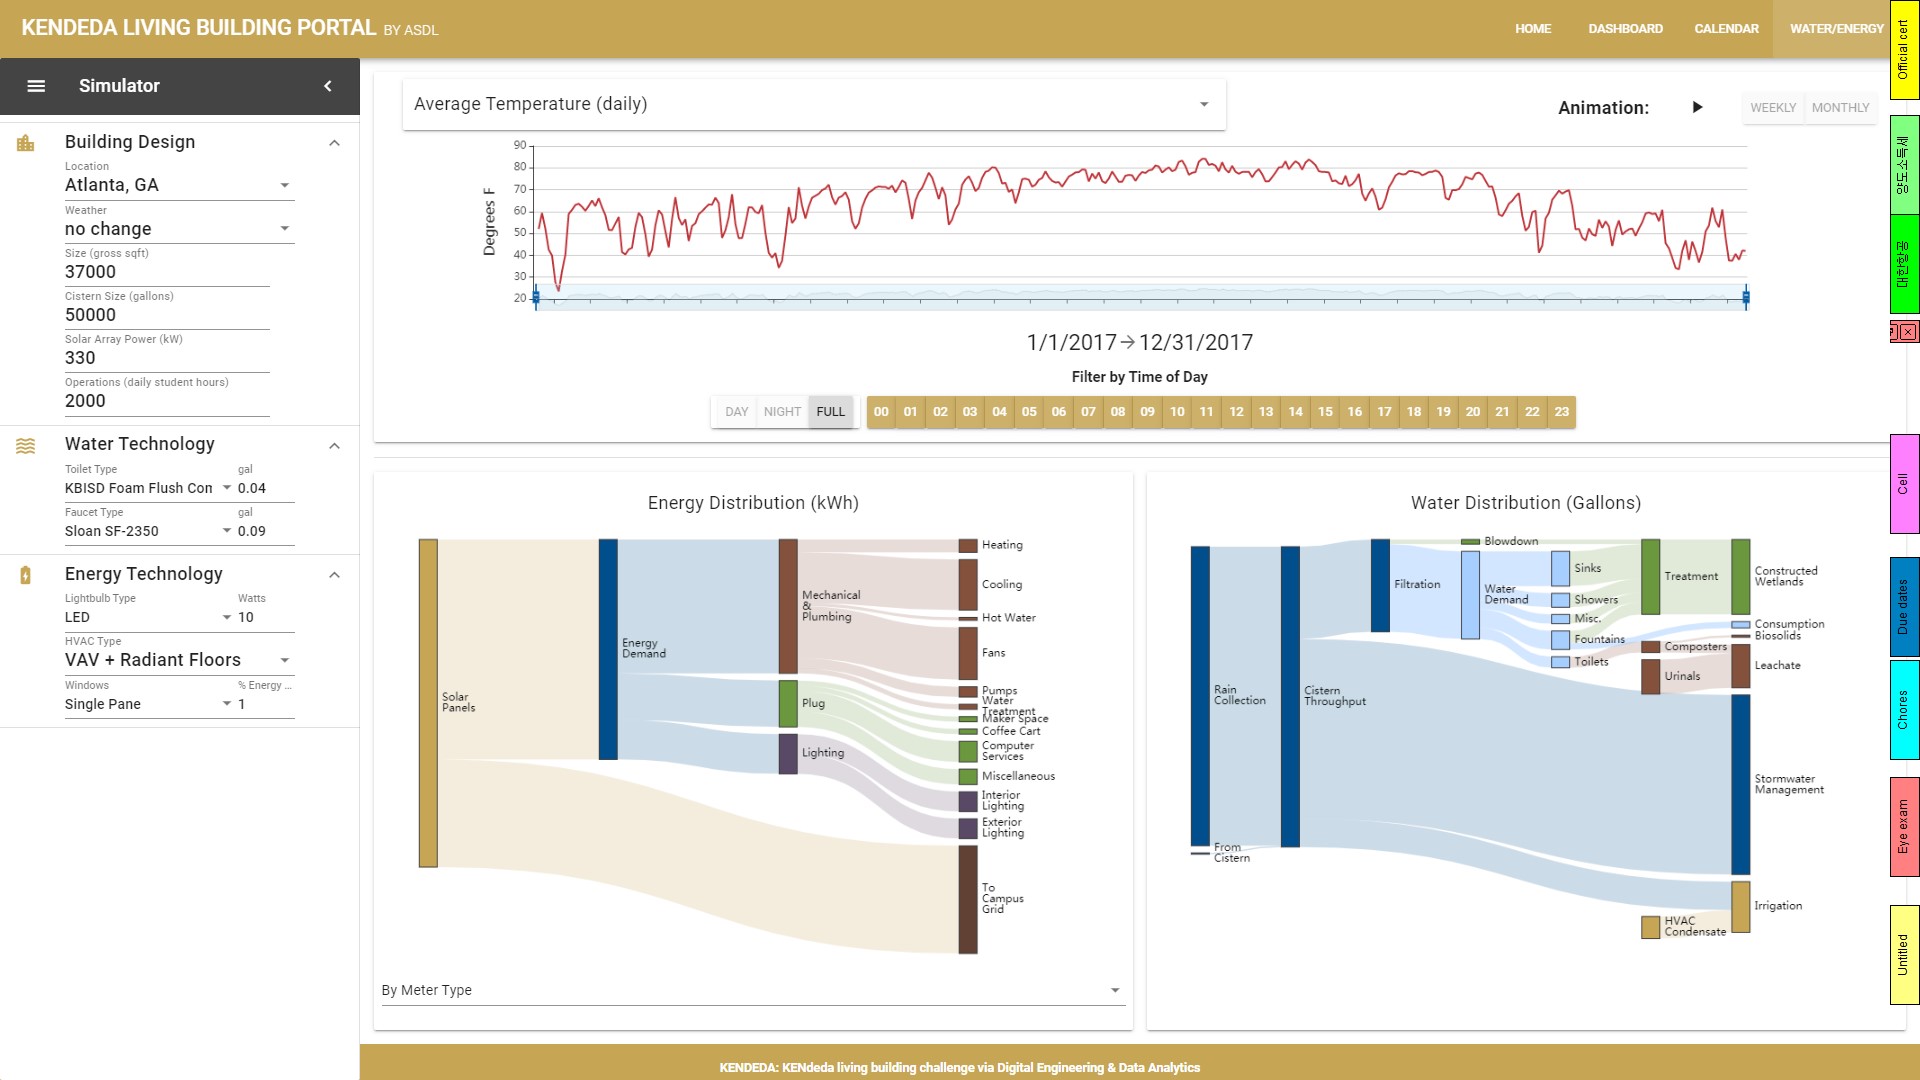
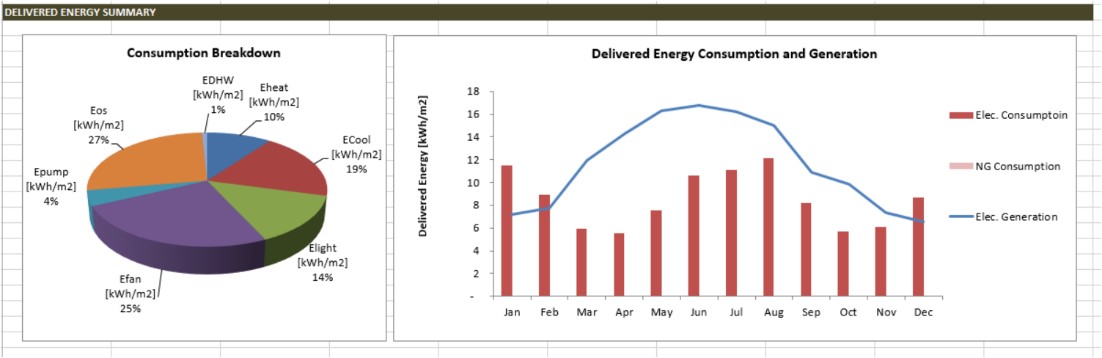
The initial architectural design was completed in Revit. All building parameters were extracted into a spreadsheet to keep track of envelope and zoning area parameters. This was fed into a customer building simulation tool called Energy Performance Calculator (EPC), developed and vetted over 10 years at the Georgia Institute of Technology. Various options were listed in the spreadsheet for iterative runs using EPC. Different scenarios were plotted to yield energy consumption pie charts and graphs for presentation to the Living Building committee. Work expanded from energy analysis to water analysis through an extension of the EPC tool to Water and Energy Performance Calculator (WEPC) by ADSL, which allowed different water scenarios (rainwater harvesting) with different collection and consumption devices to be assessed. The simulation results were imported to a Webtool utilizing Sankey plots to intuitively convey the whole picture in terms of energy and water balances depending on various conditions.
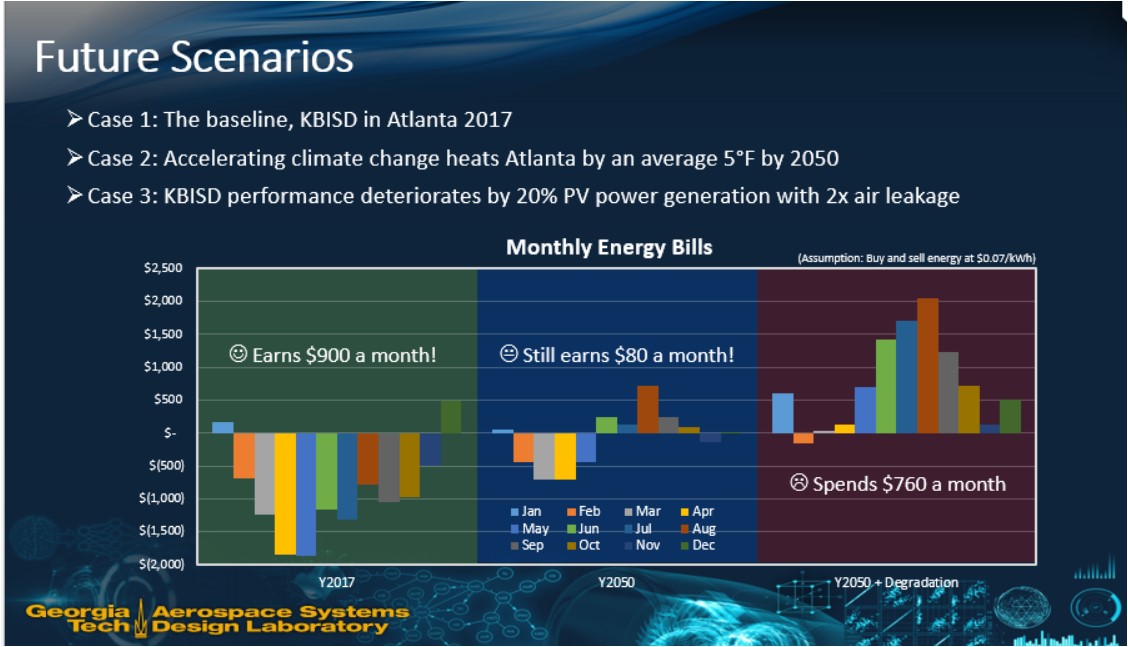
The leadership team was interested in three questions: 1. Will the building be net-positive at the end of year 1 to garner the Living Building certification (and what is the associated uncertainty)? 2. How will operational usage and real world behavior of the building (in terms of events, occupancy, and appliances, solar irradiation, and rainwater) affect the building behavior? 3. What will the building behavior (energy and water distribution) look like 30 years from now? For question 1, we graphed the energy consumption, profile, and presented the associated EUI (Energy Use Intensity) for different scenarios. Using probability distribution functions for some of the parameters and Monte Carlo risk analysis, we were able to quantify the uncertainty associated with the EUI. For question 2, EPC was expanded into a full-fledged tool called WEPC (with the addition of water). The results were displayed with a webtool that incorporated a full graphical front-end and back-end interface for ease of use. By modifying water technology, energy technology, climate parameters, and certain basic operational parameters, we're able to communicate effectively the results to the leadership team. For question 3, WEPC was used with a projected climate change and associated building degradation such as higher infiltration and PV power reduction to model the energy and water behavior in 30 years time.
We are excited to make this tool available for analysis on other similar buildings.
https://energywatch.gatech.edu/asdl-kendeda/#/water-energy