What is the impact of Passive and Active measures on the overall pEUI (kBtu/ft2) of a 20-story office building?
Olivier Brouard
Skidmore, Owings and Merrill LLP
- Olivier Brouard, Sustainability Engineering Team Leader - Eric Anastas, Digital Designer - Jason Kirkpatrick, Building Performance Analyst
Project Information
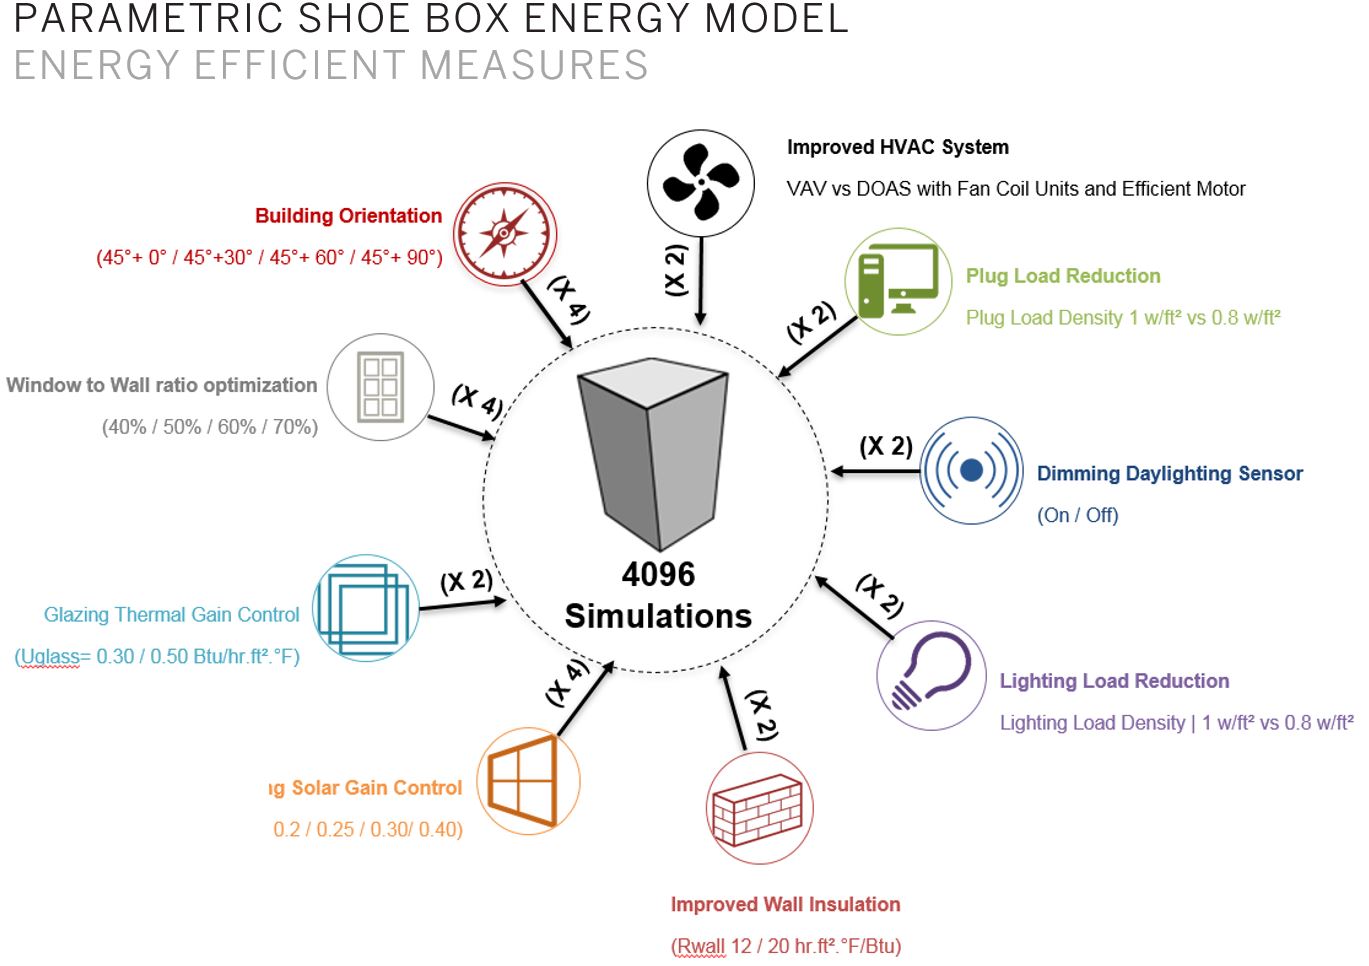
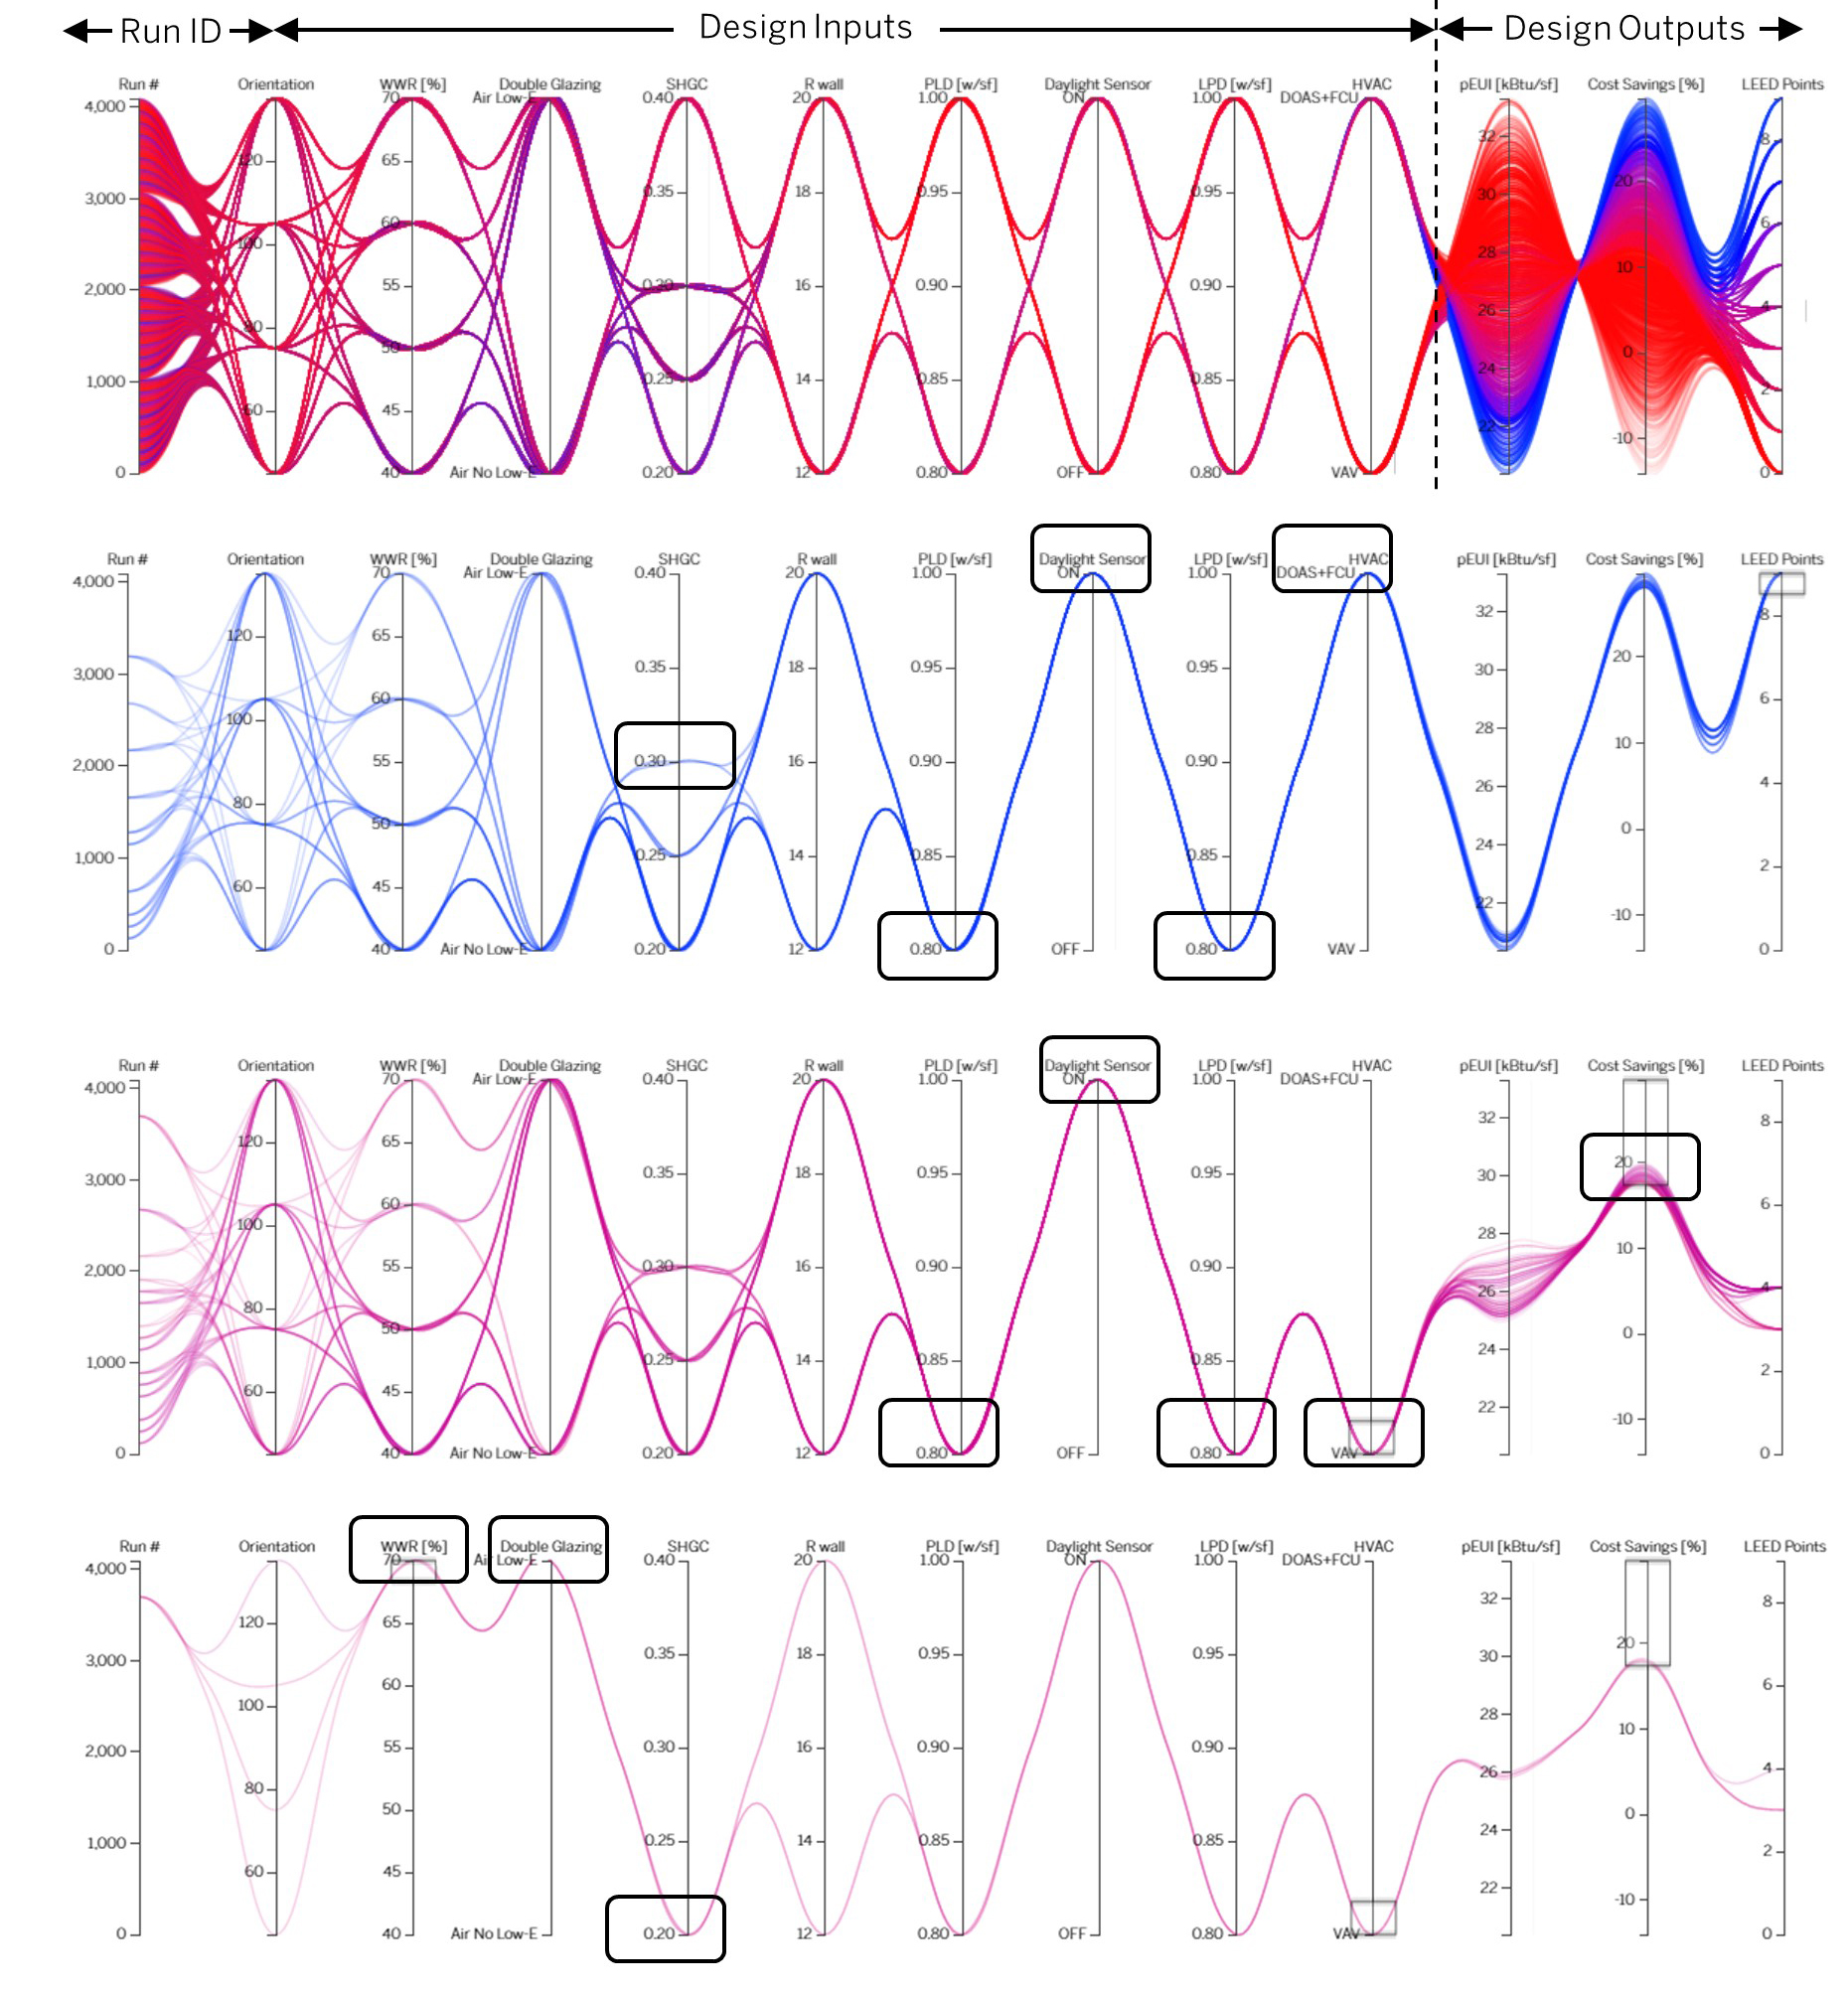
Orientation, Window-to-wall ratio, Double Glazing, SHGC, R-Value Wall, Plug Load Density, Dayligthing Sensors, Light Power Density, HVAC system
predicted Energy Use Intensity, Cost Savings %, LEED Points
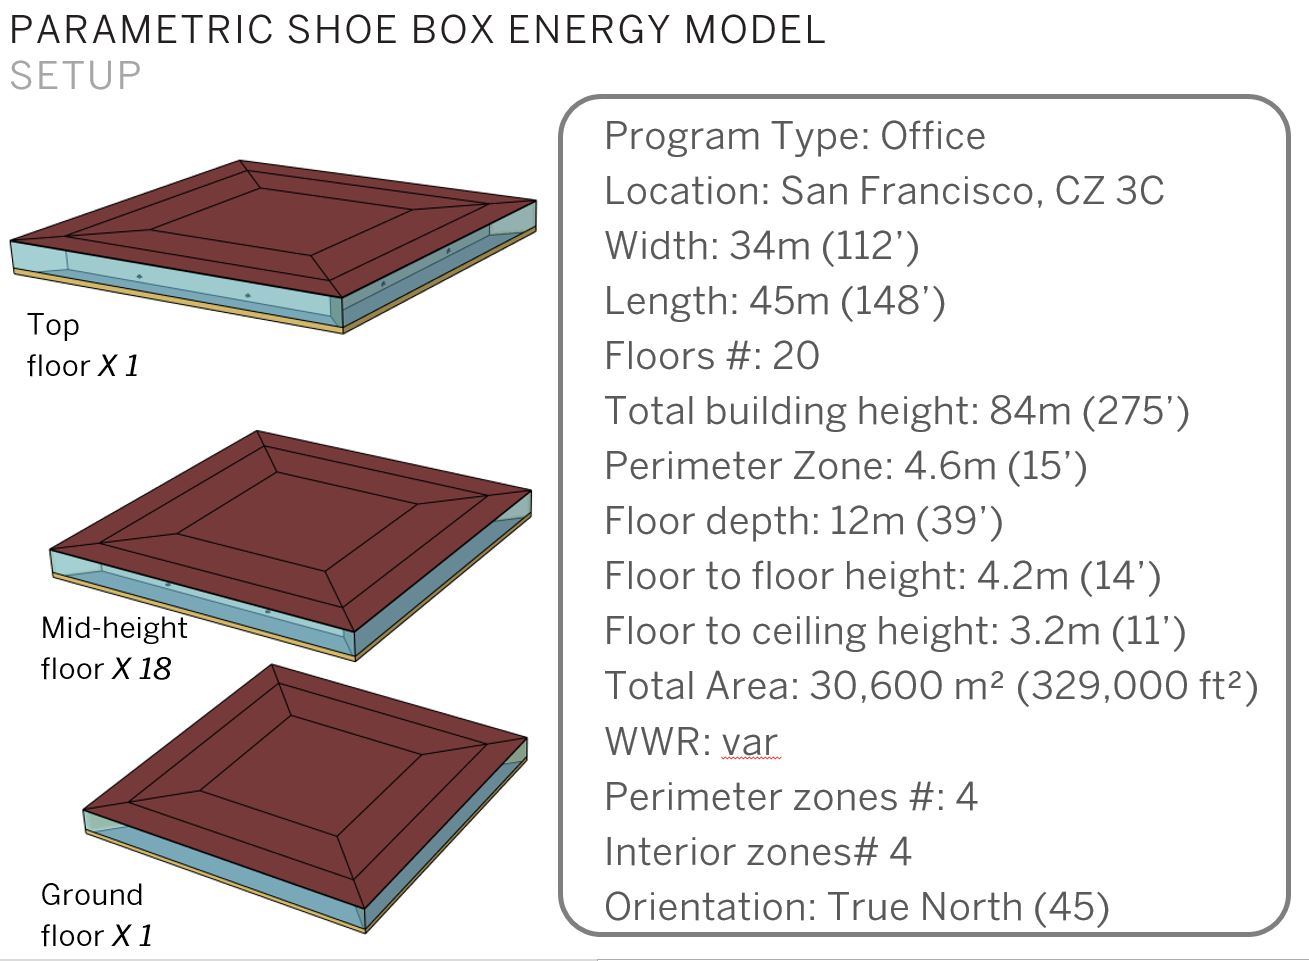
330,000 gsf
3C
94111
- Office
SIMULATION PROCESS SECTION
To understand the magnitude impact of design decisions very quickly and simultaneously.An interactive engaging exploration tool reading pre-run simulations. Leverages high multidimensional results of large-scale dataset.
- Architect - Internal Sustainability Personnel
- EnergyPlus
- Conceptual Design
The simulation was integrated at concept design to allows designers to simultaneously see the impact of design solution on multiple performance criteria. This tool was used as a way to run a live energy model and influence the design process directly before decisions were made. Customizable and optimized for storytelling. Provides real-time feedback to Design Team to highlight major findings.
- Used D3 - a JavaScript library for producing dynamic, interactive data visualizations in web browsers. - Download d3.parcoords (parallel coordinates) open source code - Modify & add Functionalities to the code - Ran a shoebox energy model using jEplus and Open Studio - Created an excel spreadsheet csv file with inputs and outputs - Link the database csv file to the D3 HTML code - Designed and Formatted with the firm Standard - Visualized the tool running a Javascript Node Server locally or on an intranet server
The graph highlights all the possible permutations computed for the variable studied. The baseline is based on the ASHRAE 90.1 2007 standard [Appendix G] orienting the building at a true North angle of 45°. The results were shown in a HTML page directly to the design team. The architects used the selectors to filter through the parameters and figured quickly the path to get to their goal.
I wished I could have added the upfront cost of the design variables to weight in the return on investment and payback period.