What is the impact of an approach that generates feasible ranges of design parameters on target EUI (kWh/m2/yr) and decision making?
CHEOL-SOO PARK
Cho, Seongkwon; Kim, Jae Min Kim; Youngsub; Ko, Yundam; Yi, Dong Hyuk; Ahn, Ki Uhn
Project Information
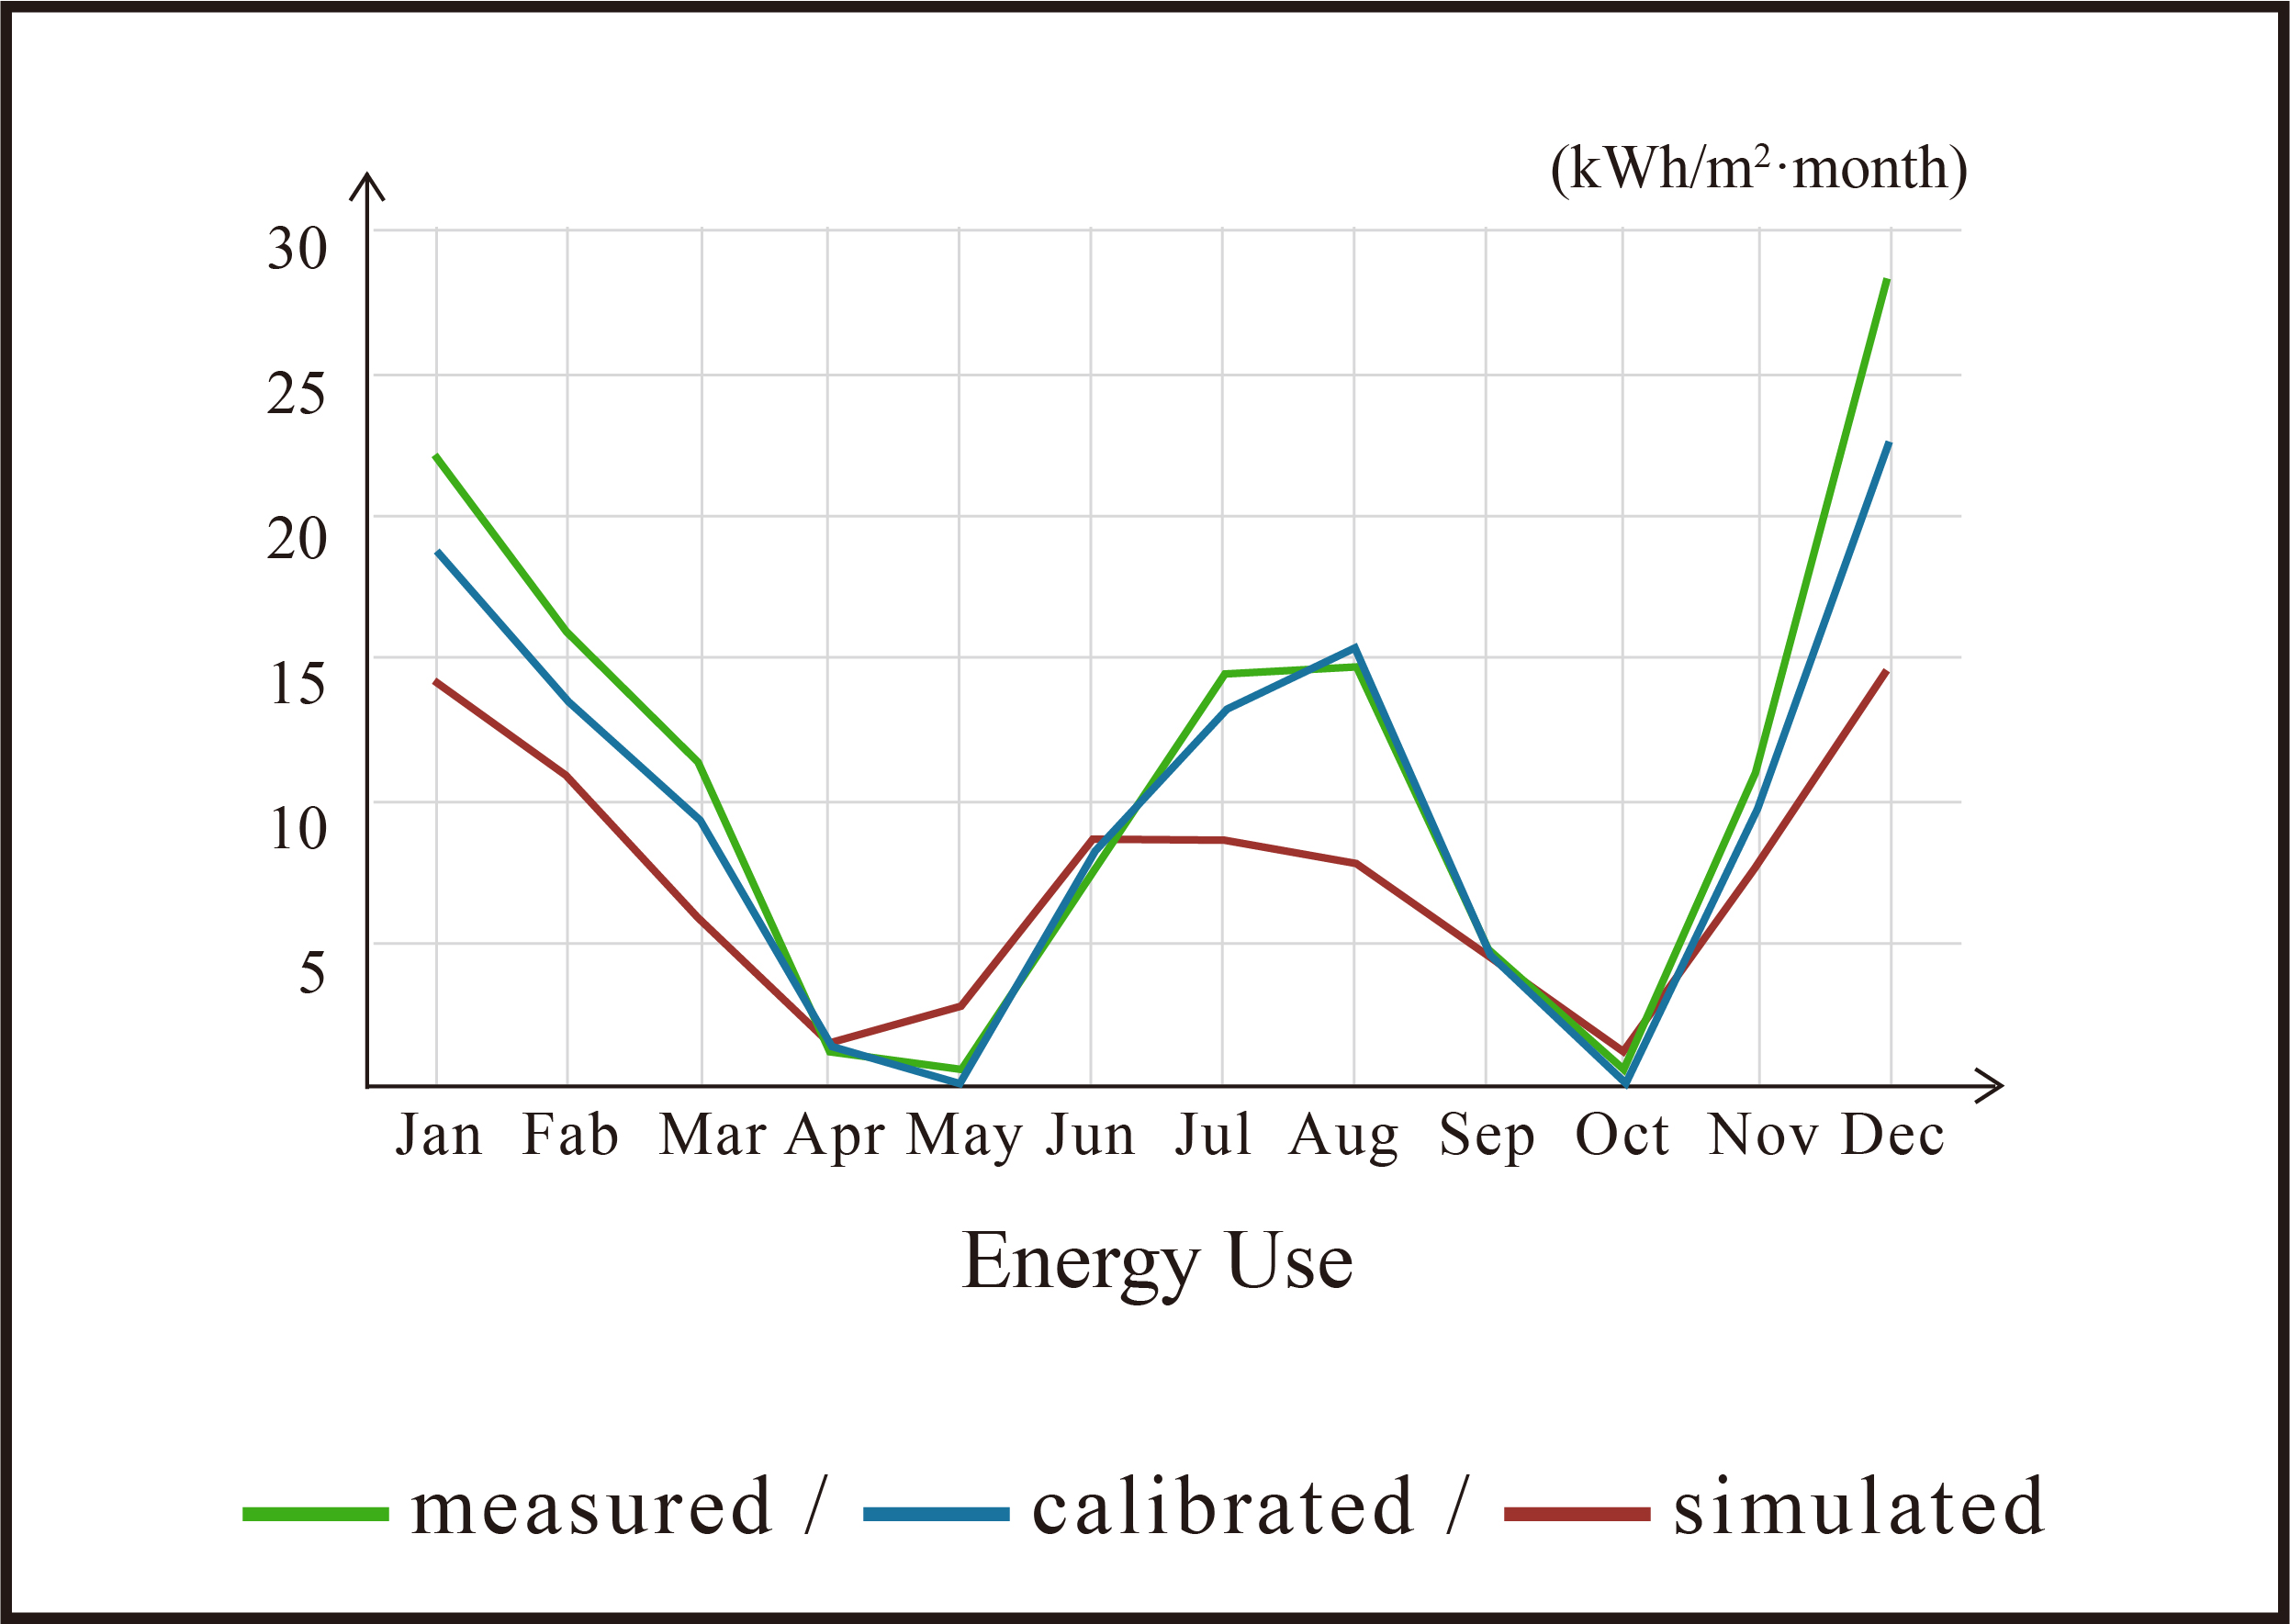
Energy model, weather data, measured monthly energy use
Feasible ranges of design parameters meeting target EUI, Sensitivity ranking of design parameters, Probability density function of EUI, Inferred energy performance of the existing building after energy retrofit
4,599 m2
4A
- Education
SIMULATION PROCESS SECTION
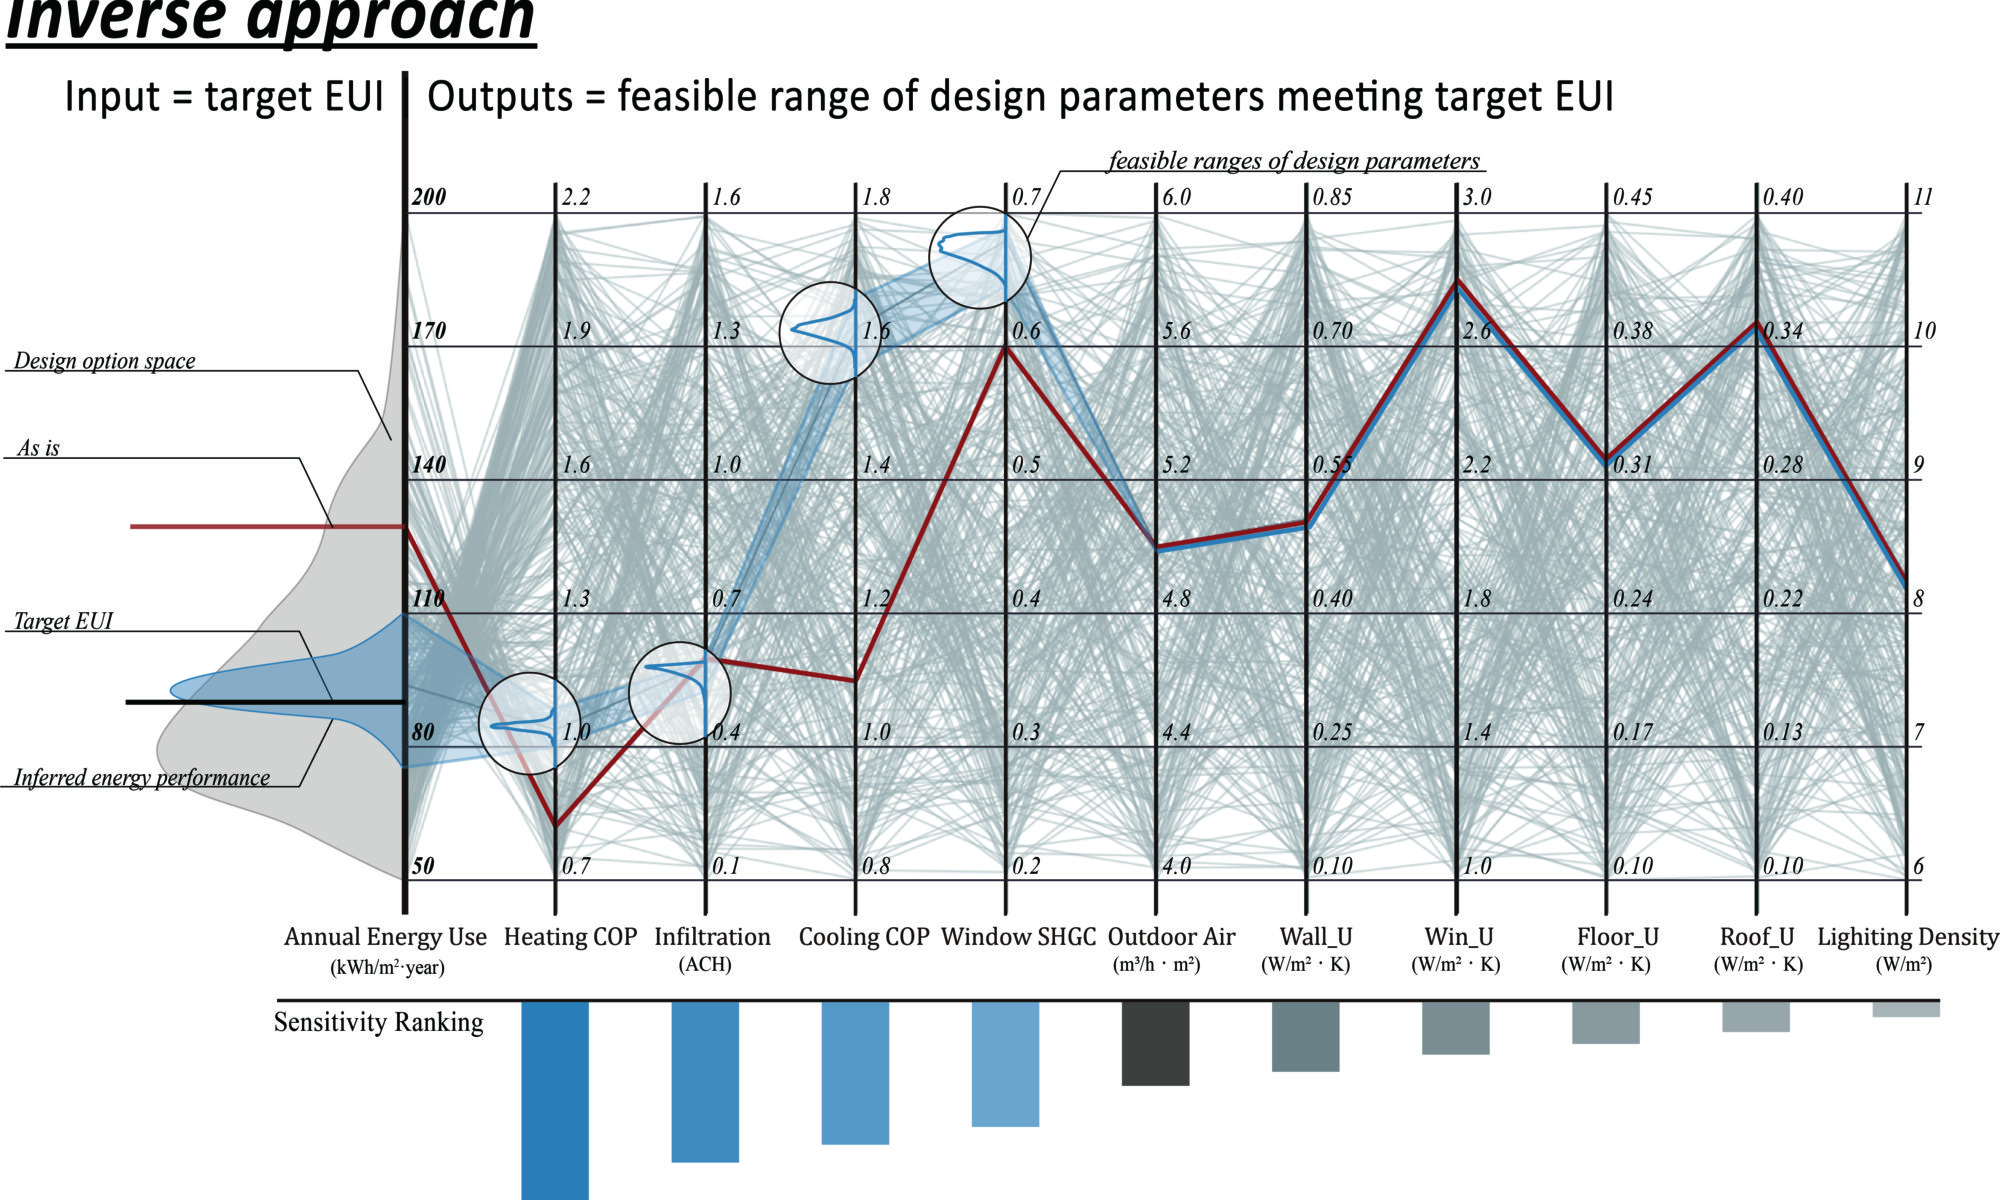
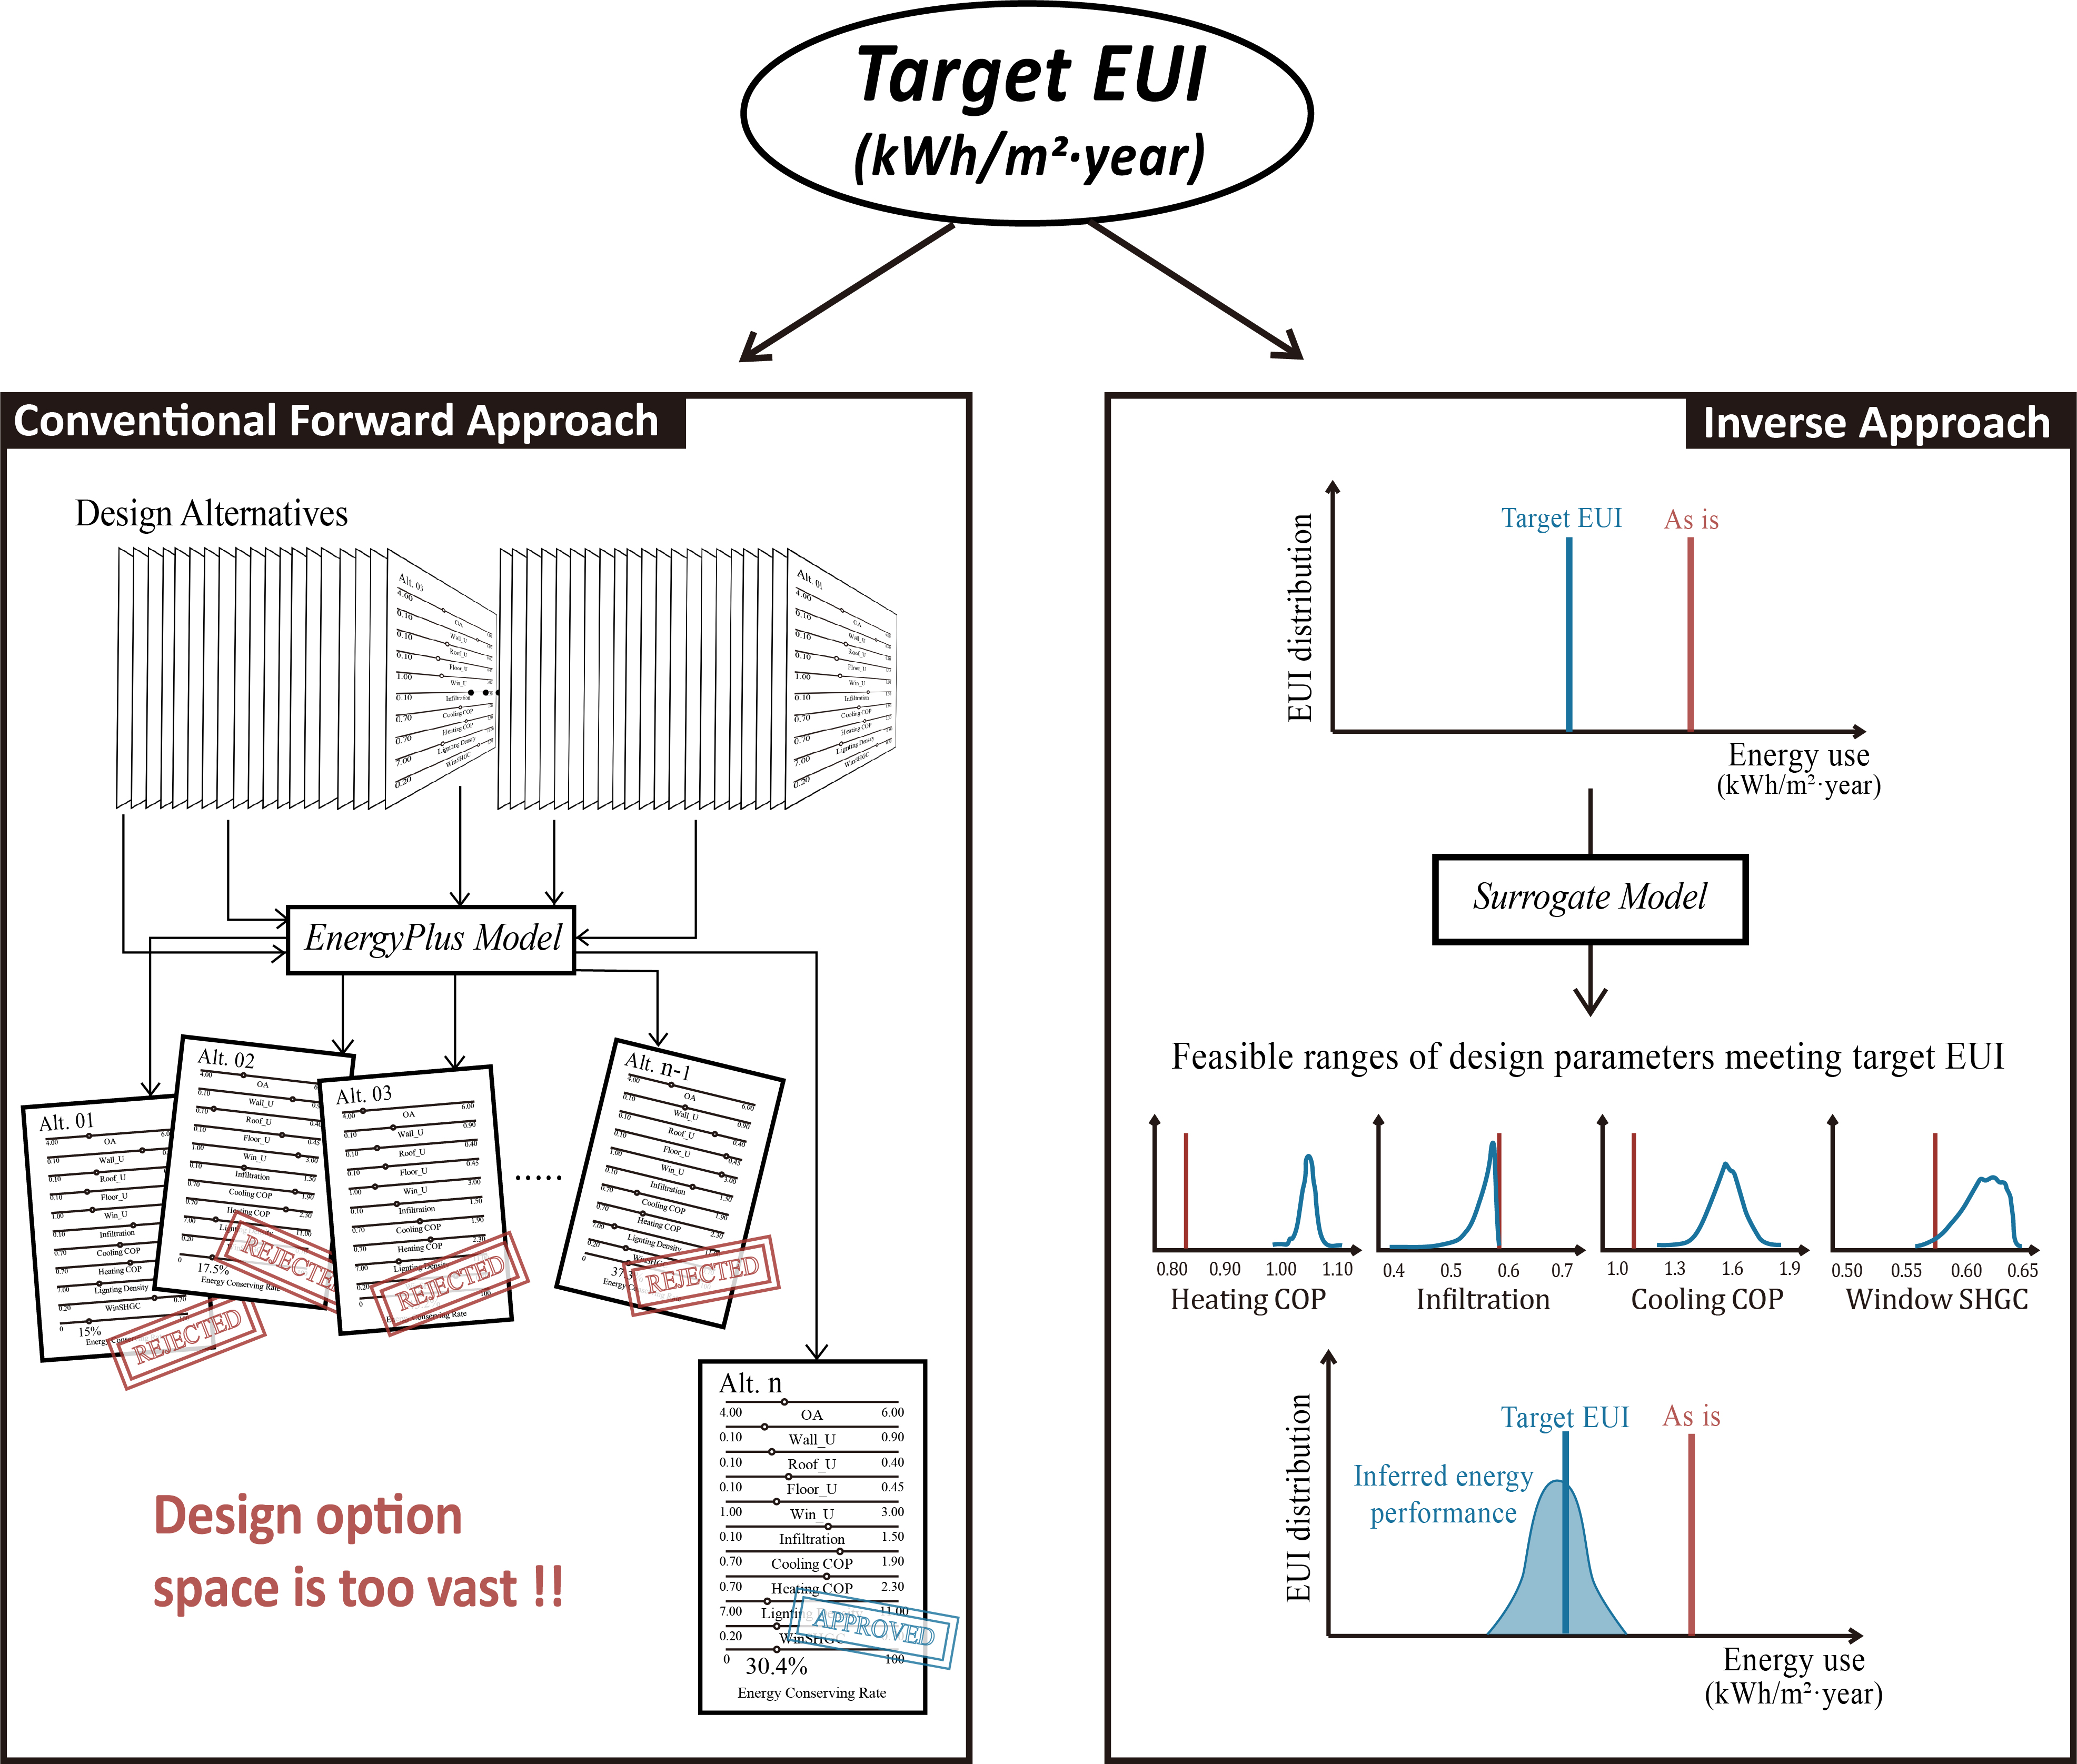
The current building performance simulation workflow takes a forward approach where building simulation tools find simulation output (e.g. EUI) given design parameters. In contrast, the inverse approach presented in this case study can find feasible ranges of design parameters given a target EUI.
- University
- Design Builder + Eplus
- Post Occupancy
In the forward approach where design parameters are input and EUI is output, the number of possible design solutions is too many to conduct an exhaustive search because multiple continuous and discrete design parameters are involved. In addition, the impact of each design parameter on EUI must be identified for time-efficient search of design solutions. In contrast to the forward approach, target EUI is input and feasible ranges of design parameters are output in the inverse approach. The inverse approach can be used for rapid exploration of design solutions and rational decision making. For this purpose, this case study was intended to generate feasible ranges of design parameters that meet a target EUI (90 kwh/m2/yr) and a 30% energy savings target of an existing education building. As a result, what follows is found: (1) sensitivity ranking of significant design parameters of the existing building, (2) feasible ranges of design parameters meeting target EUI, and (3) inferred energy performance of the existing building after energy retrofit.
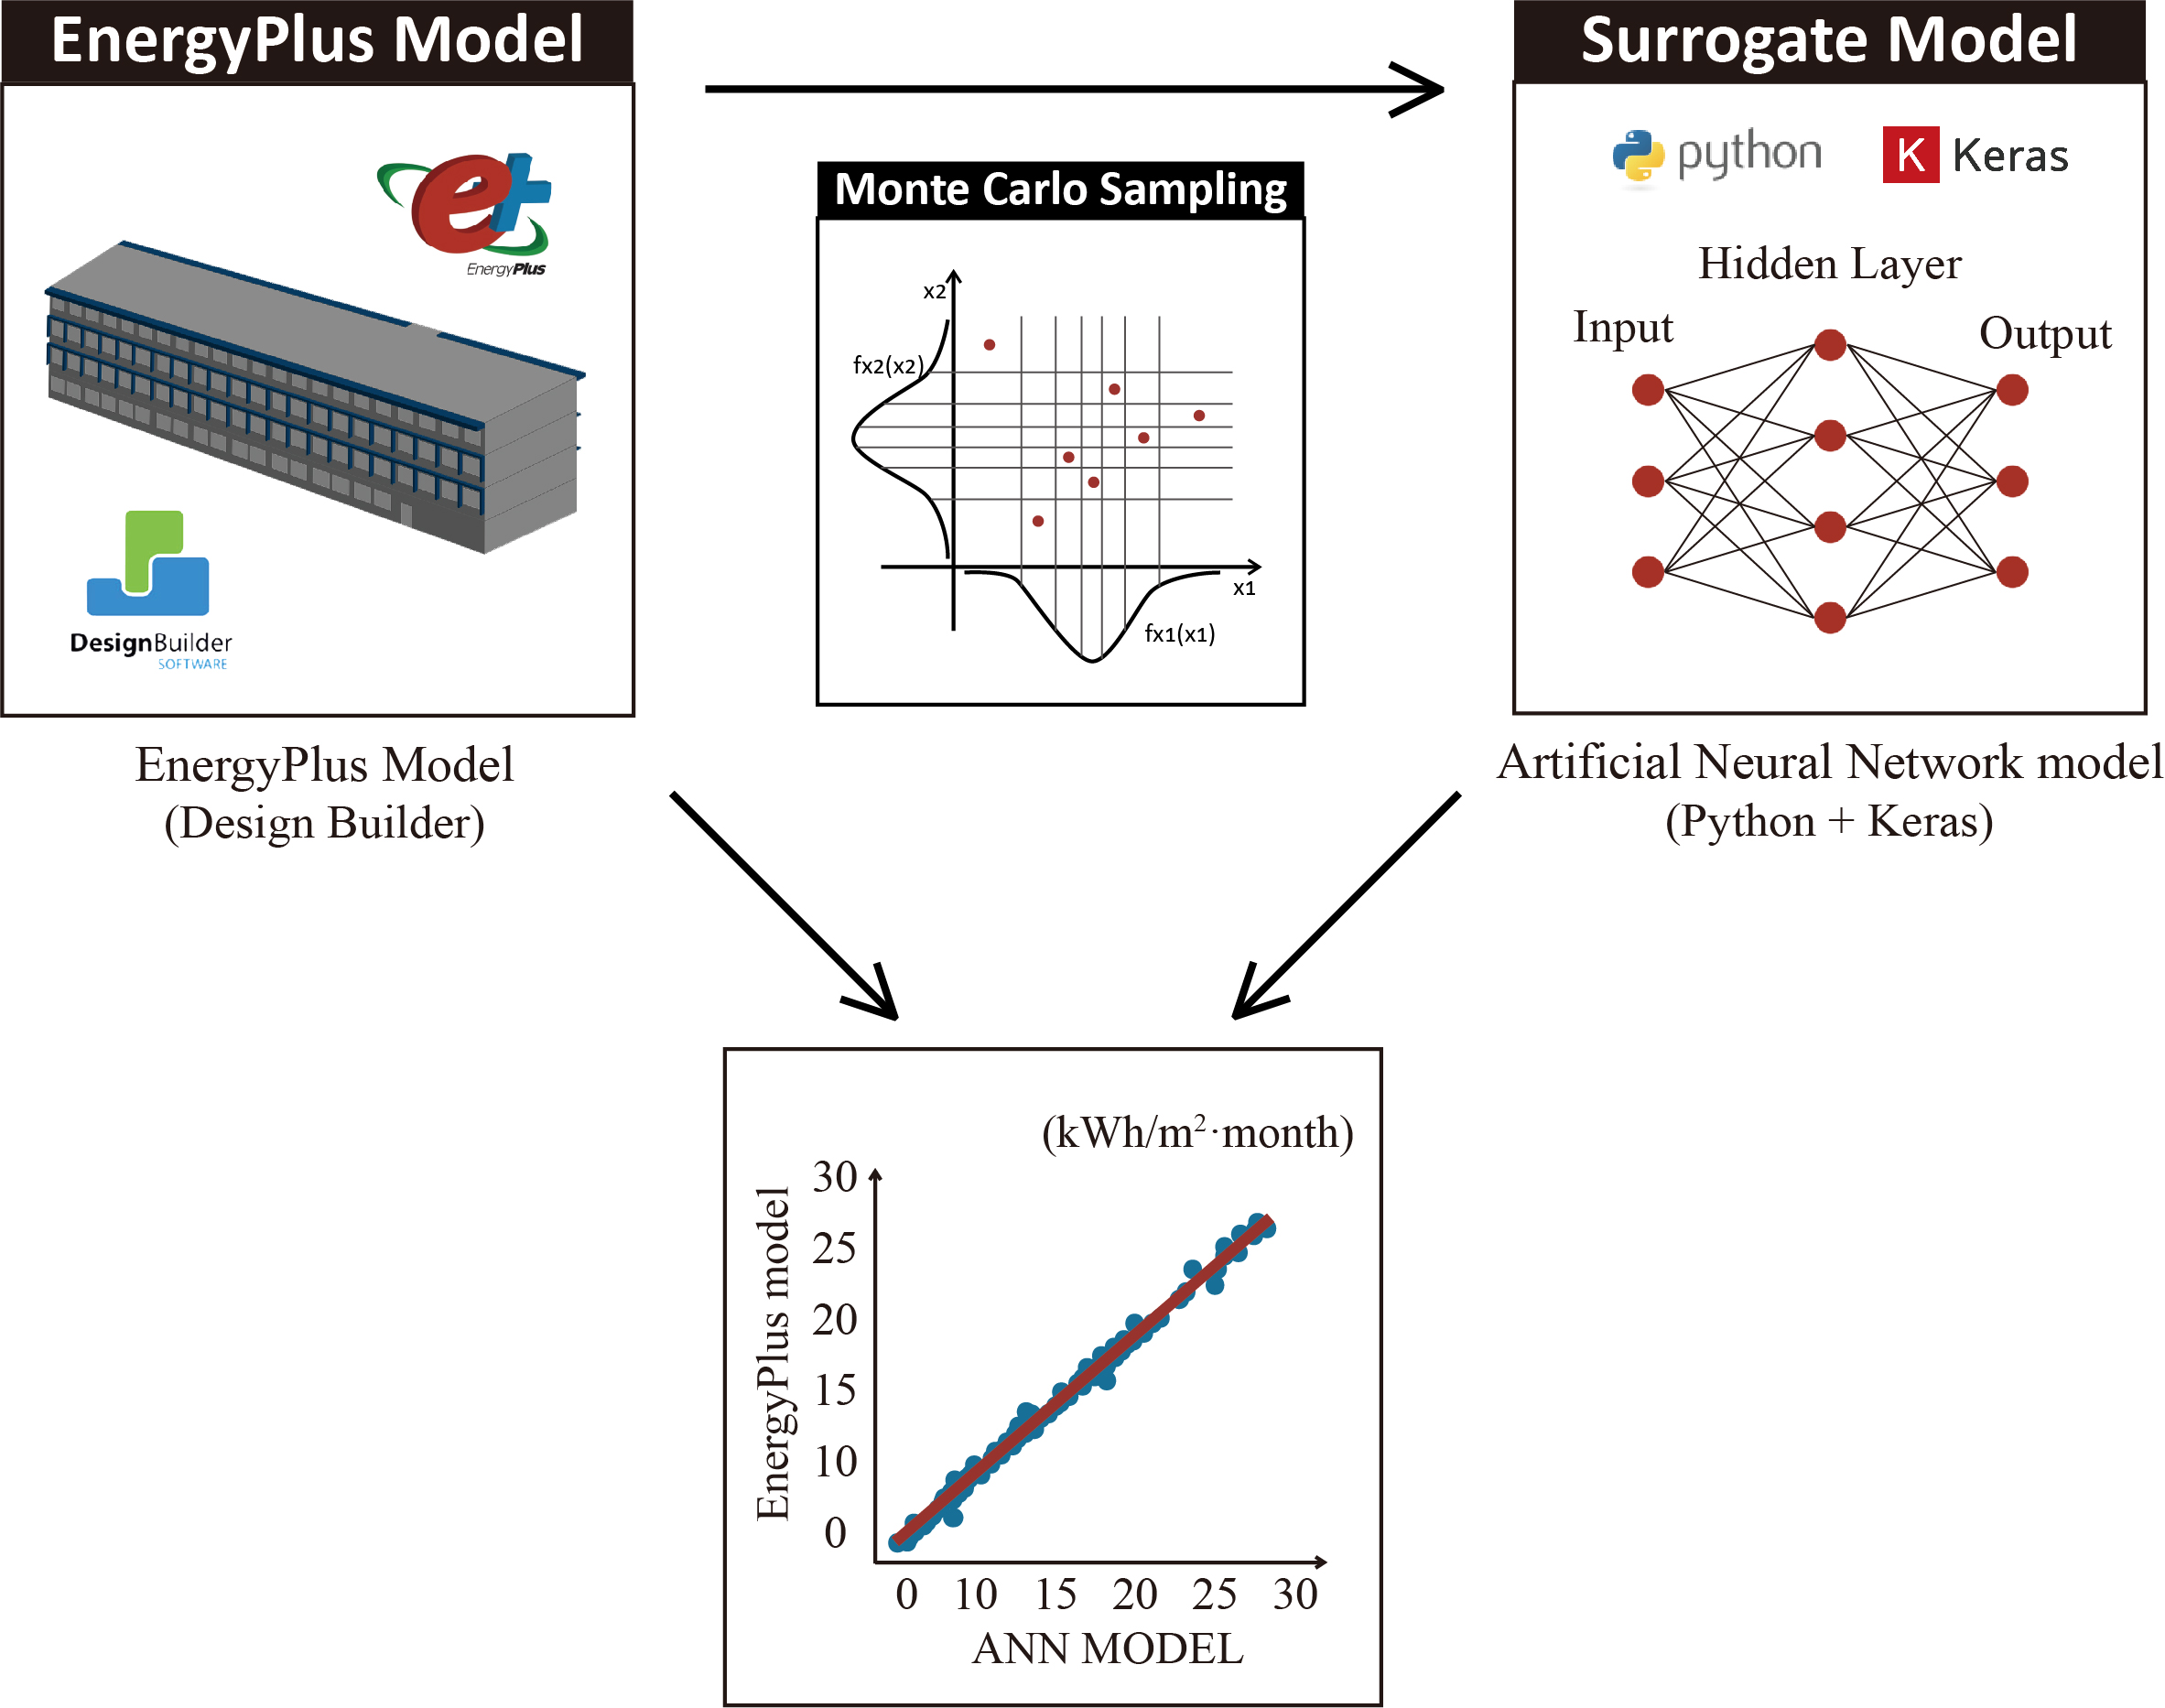
1) Developed an energy model of the existing building using DesignBuilder. 2) Conducted one of the Monte Carlo samplings, Latin Hypercube Sampling using MATLAB. The number of simulation samples was 1,000. 3) Because Bayesian calibration demands significant simulation running time, a reduced-order surrogate model, Artificial Neural network (ANN) Model, was constructed based on 1,000 simulation samples generated at Step 2. The ANN model was made using Keras, the Python deep learning library. 4) Ten uncertain parameters were estimated using Bayesian calibration using PyMC3, a Python package for Bayesian statistical modeling. 5) The Sobol method, one of the global sensitivity analysis methods, was conducted to identify significant design parameters. The Sobol is suitable for complex nonlinear models and can consider interactions effects. The Sobol analysis was conducted using SALib, an open-source sensitivity analysis library written in Python. After the Sobol analysis, four significant design parameters were identified including heating COP, cooling COP, window SHGC, and infiltration. 6) Bayesian inference, an inverse uncertainty analysis method, was conducted to obtain plausible ranges of four design parameters which could meet the target EUI (less than 90 kwh/m2/yr) and 30% energy savings target.

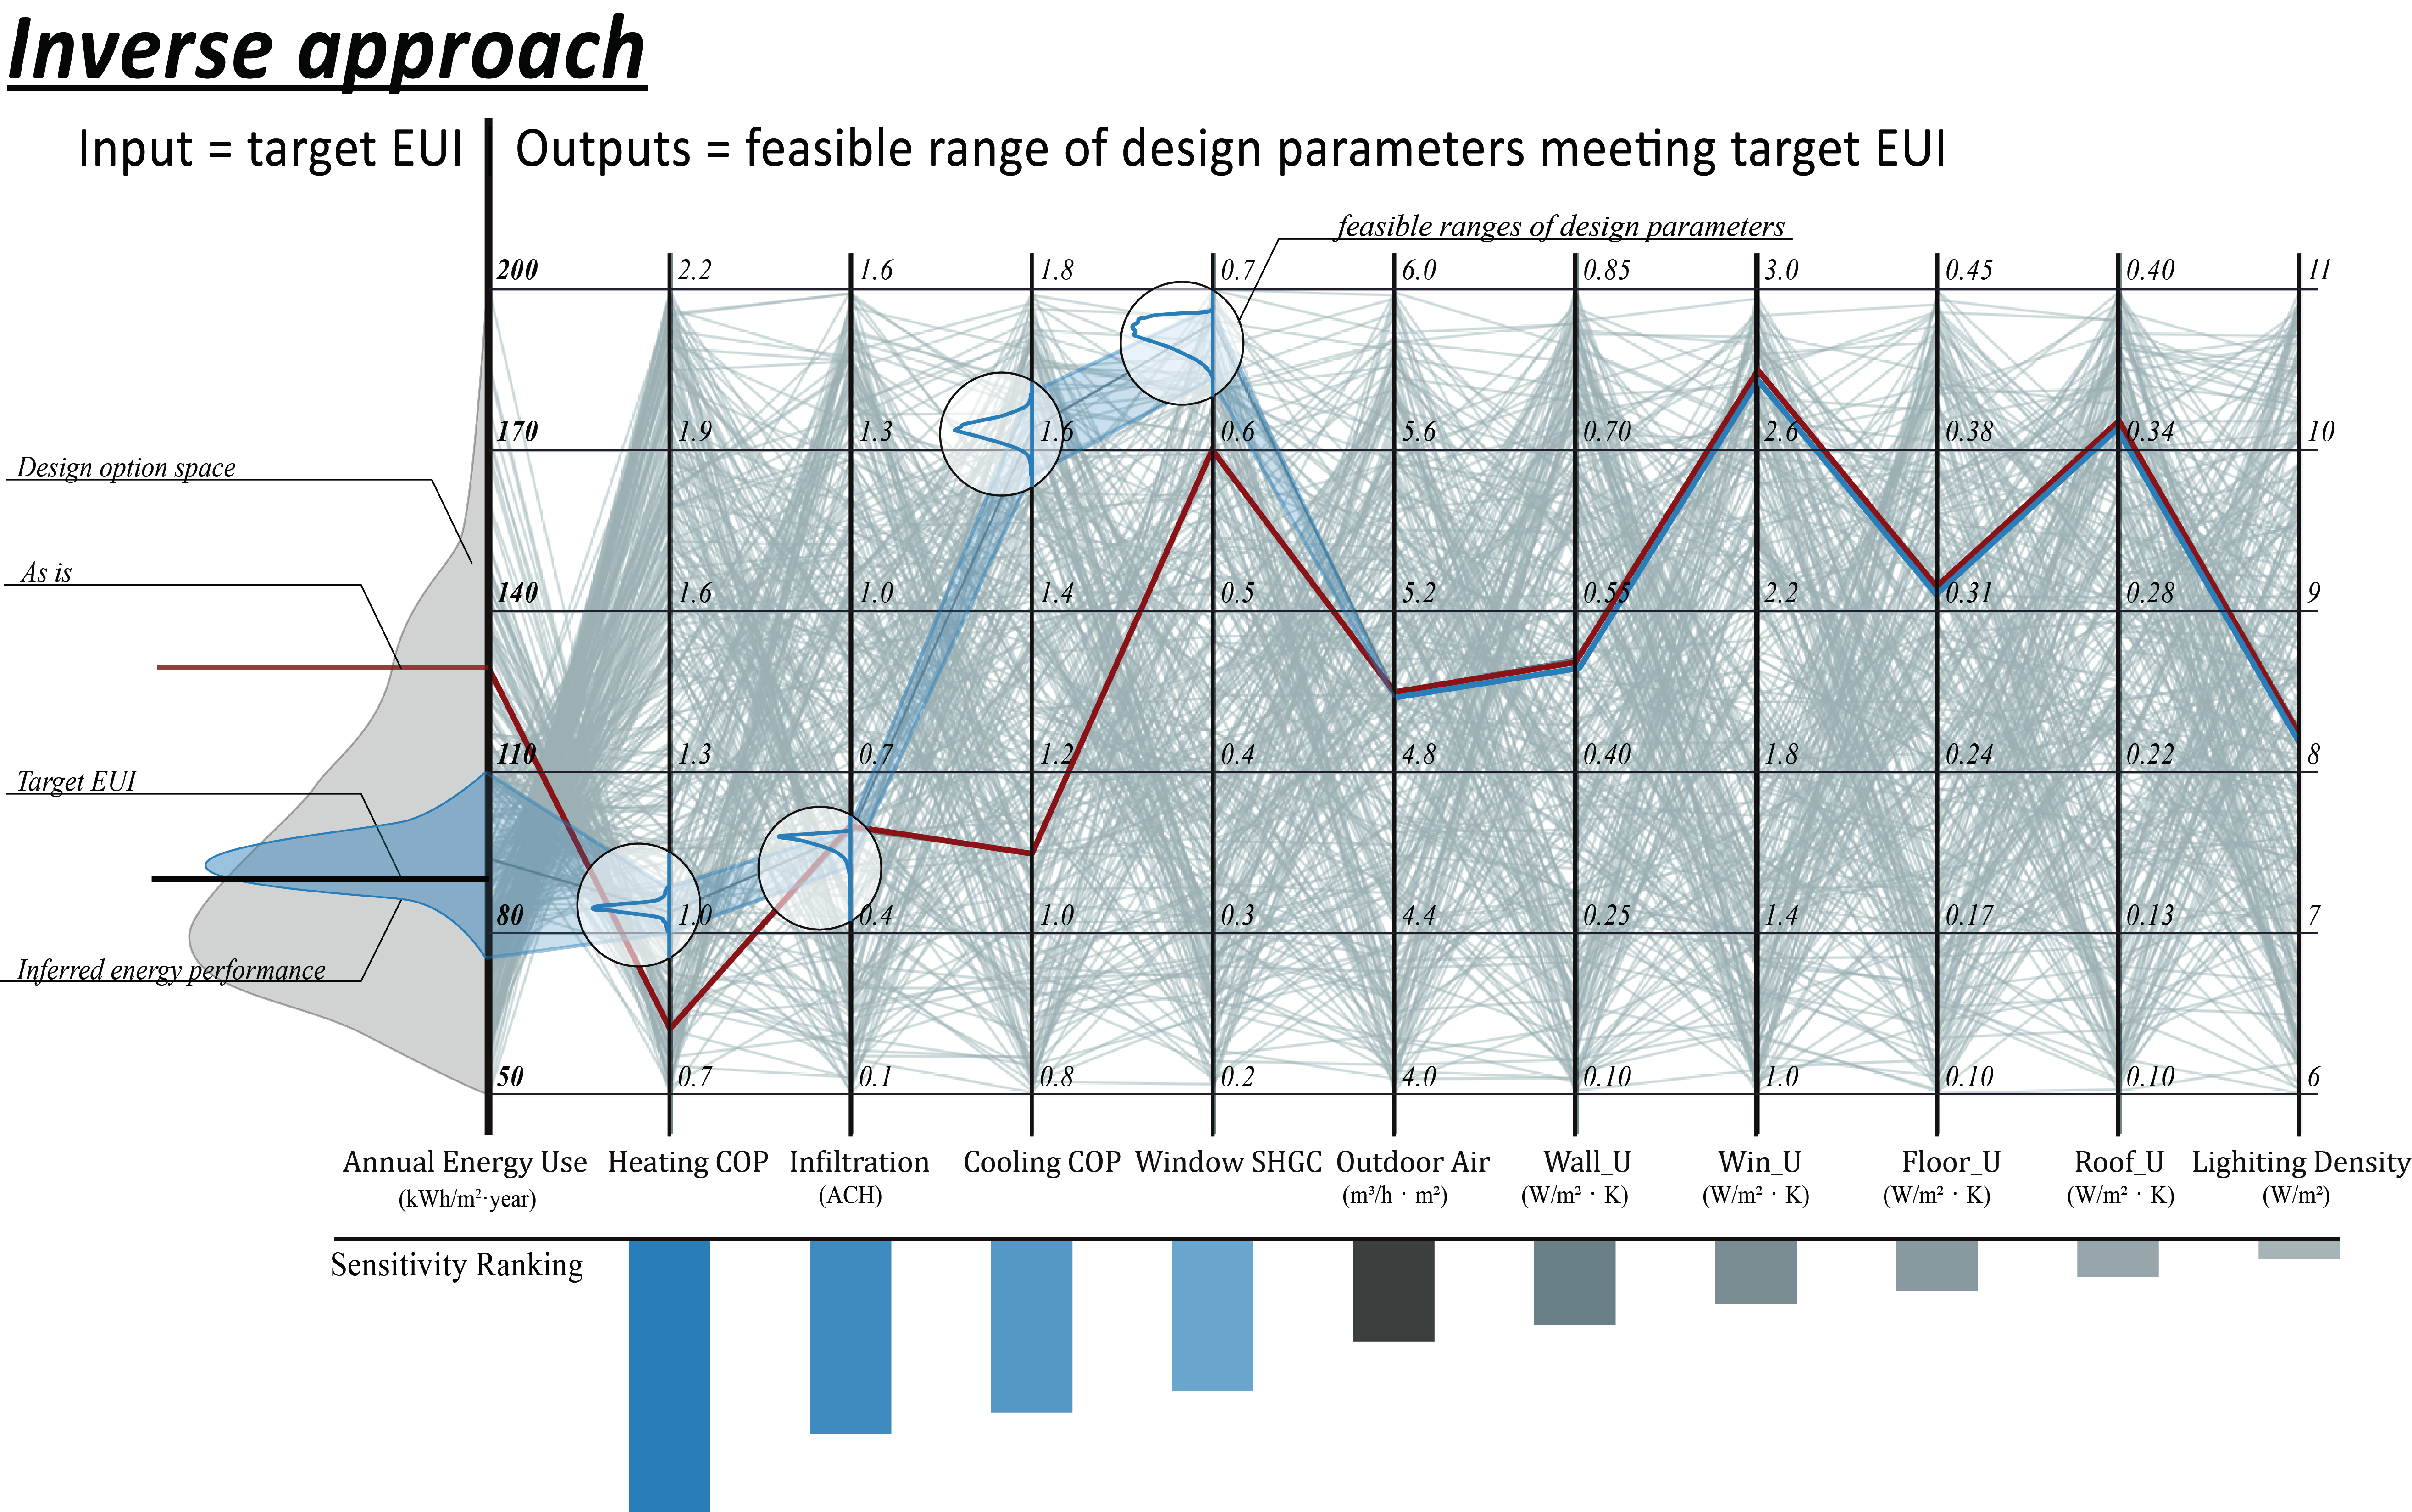
We visualized the results using an ‘inverse’ parallel coordinates chart. Please note that the conventional parallel coordinates chart starts from design parameters (from left) to EUI (to right), while our ‘inverse’ parallel coordinates chart starts from the target EUI to feasible ranges of design parameters. When building stakeholders change target EUI on the left, they can see how the input (target EUI) influences feasible ranges of design parameters (output).
N/A
https://www.youtube.com/watch?v=AhXZXrlRbaU