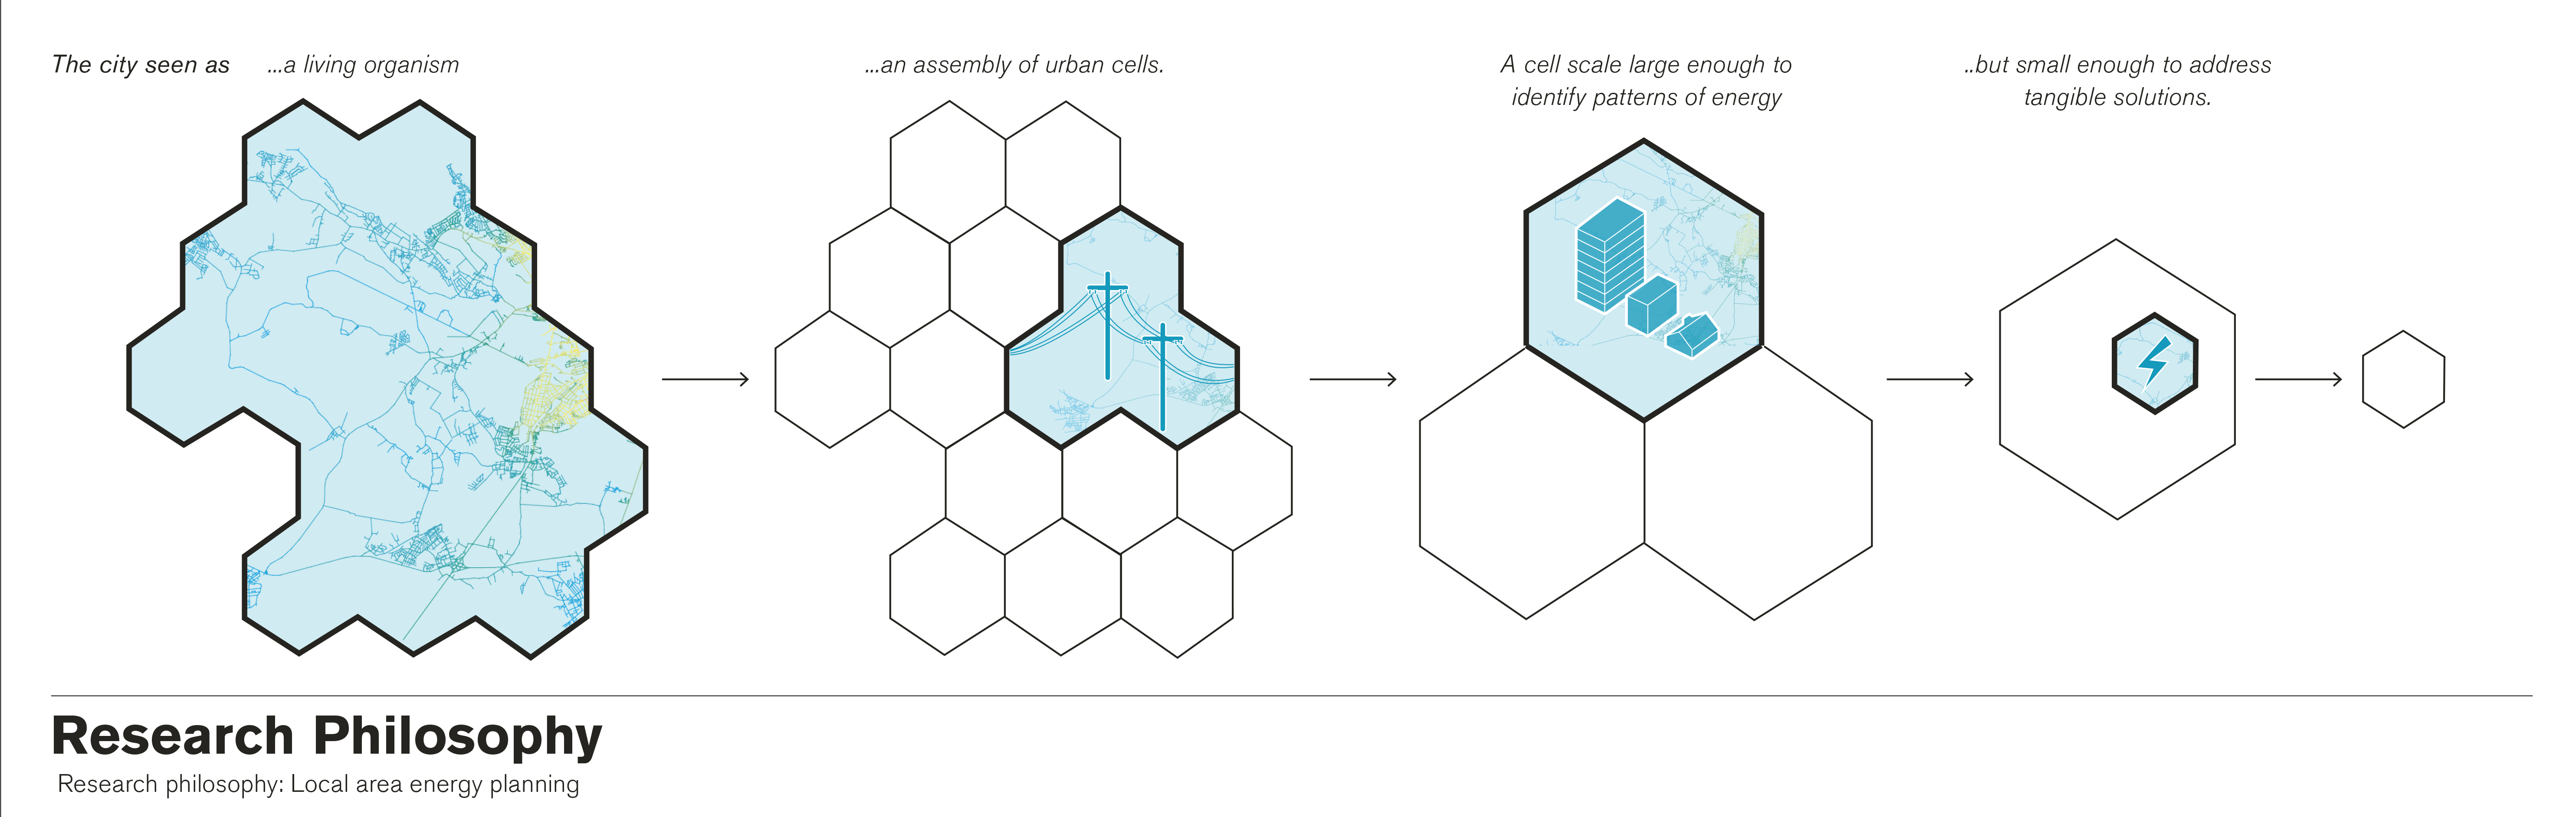
What is the impact of data-driven bottom-up energy modelling approach on local-area energy planning?
Joey Aoun
Foster + Partners
Project Information
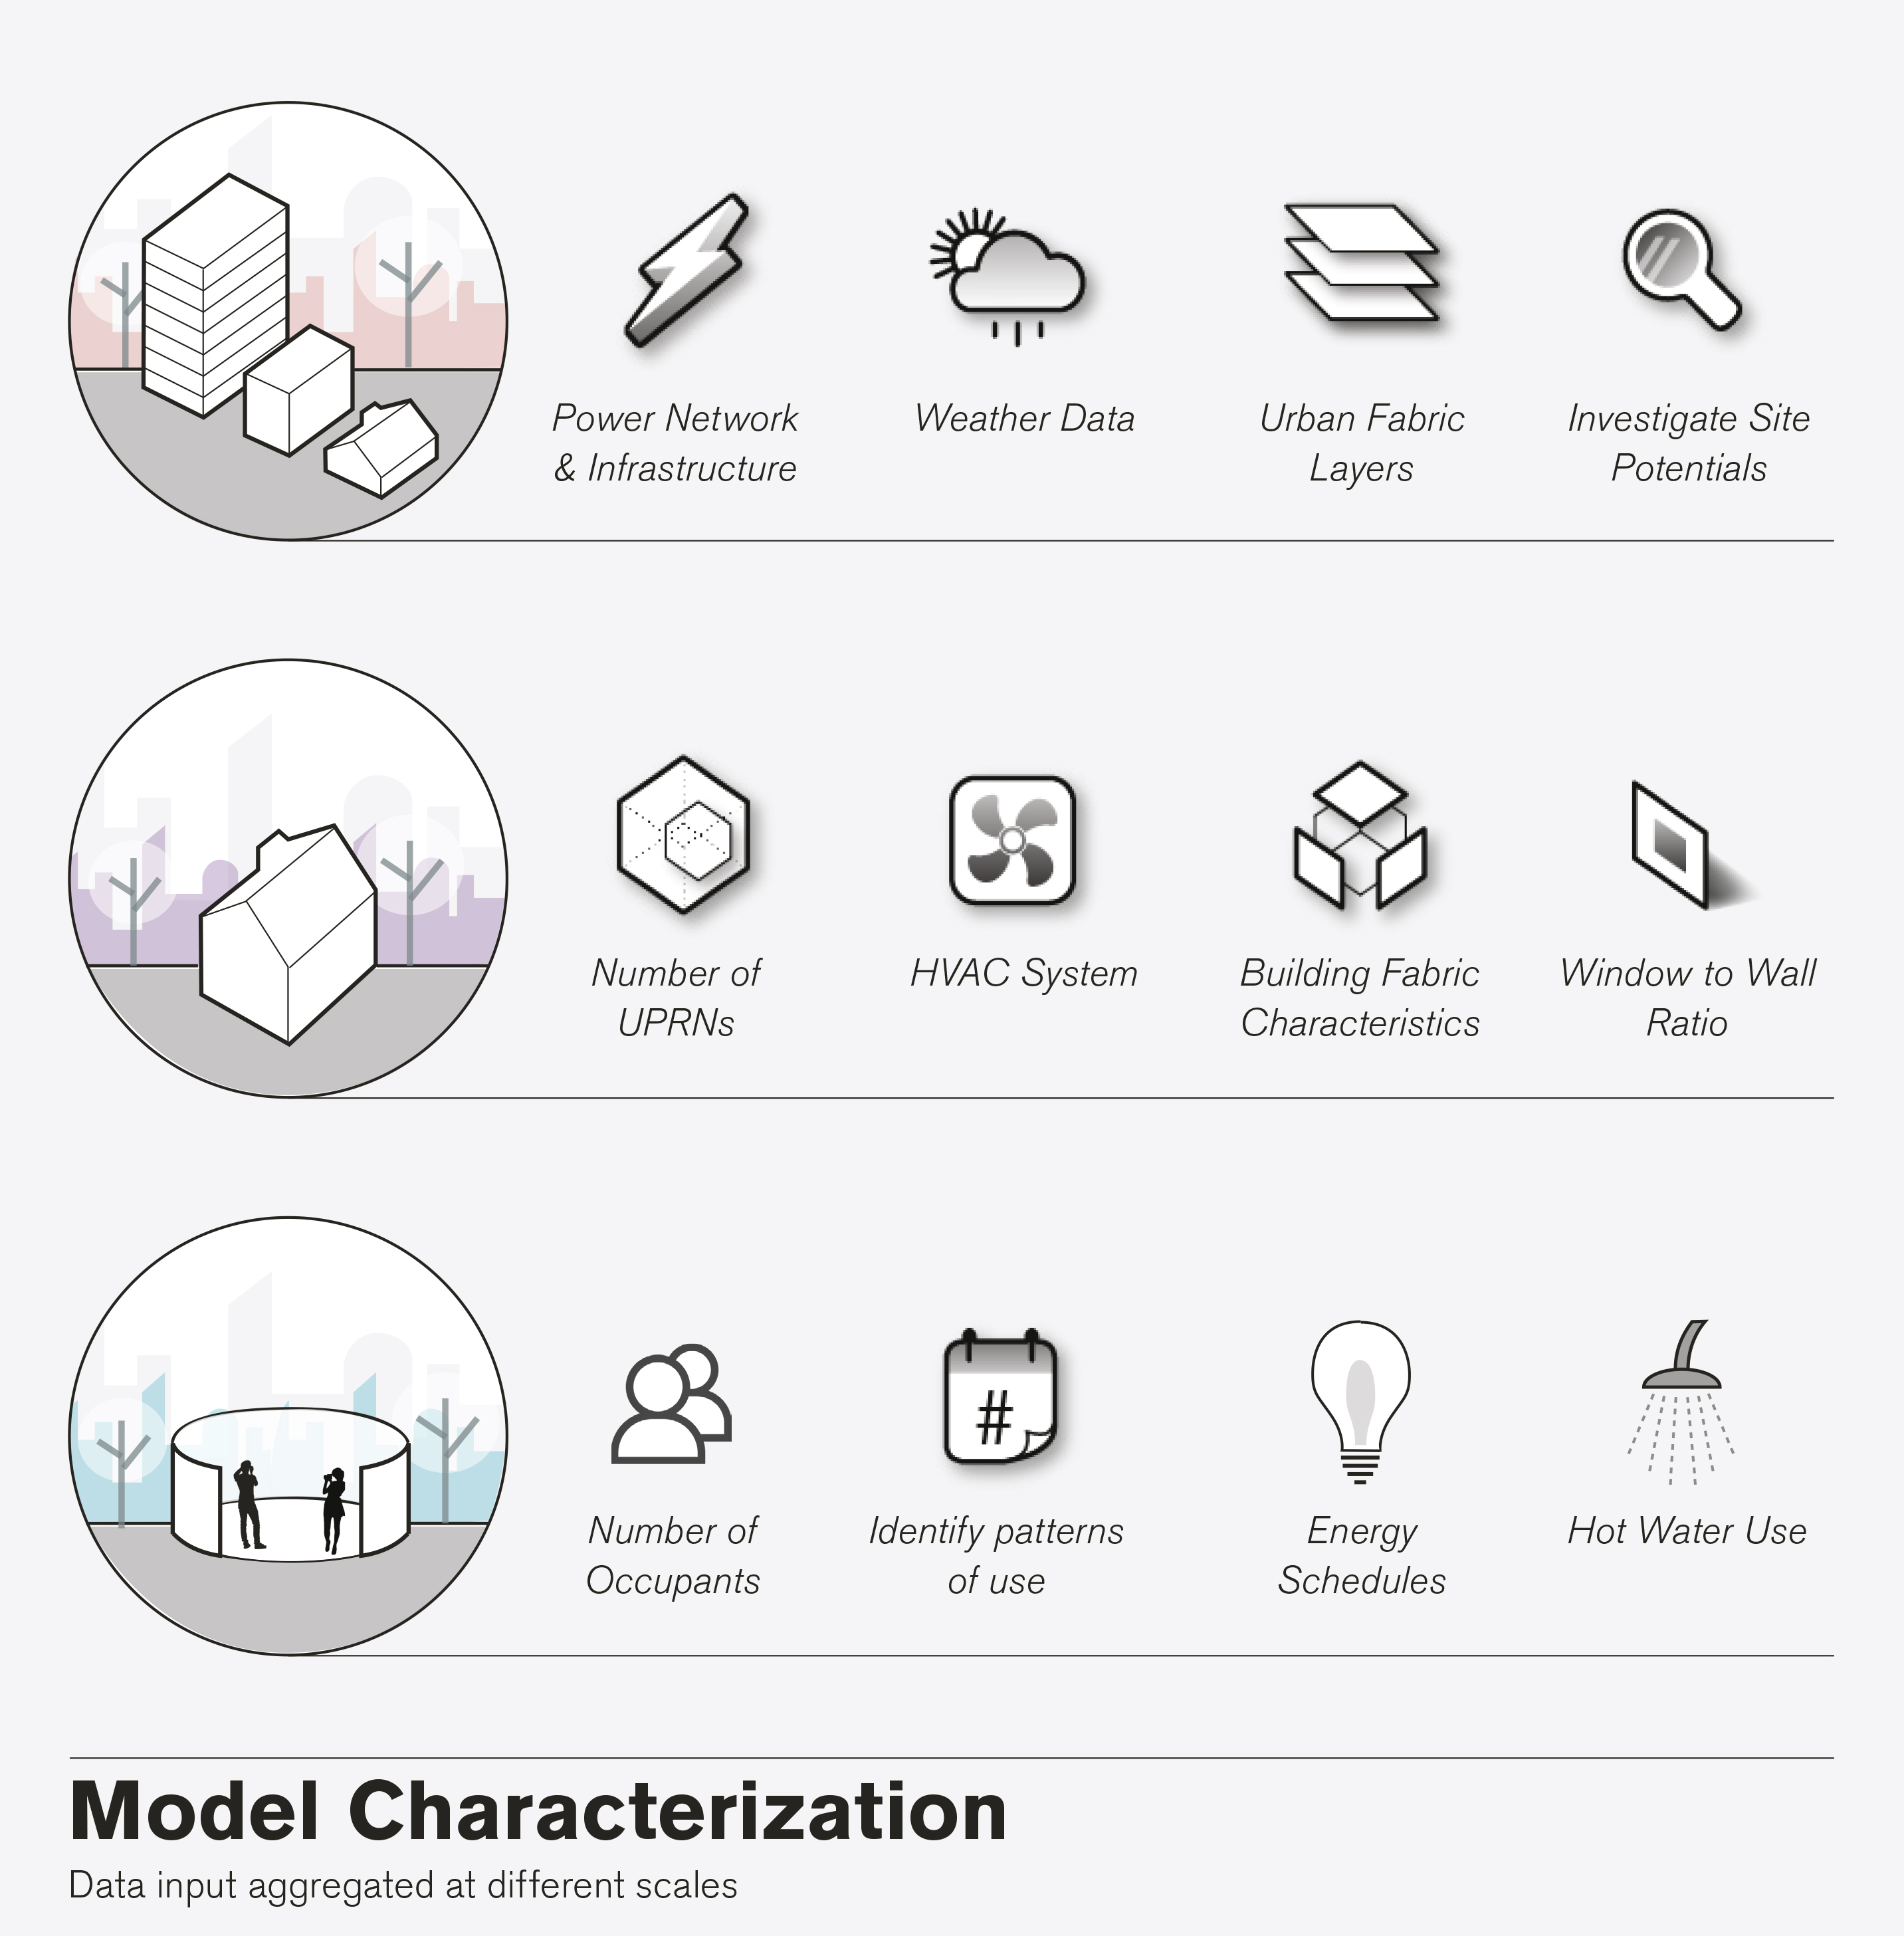
Publicly accessible urban building data: Geometric data and non-geometric data. Geometric data: building footprint/ polygon and building height; Non-geometric data: Weather data, urban infrastructure mapping, building land use, Unique Property Reference Number (UPRNs), Post code, zones conditioning/ HVAC system, envelope thermal properties, window-to-wall ratios, number of occupants, and pattern of energy use/ schedules.
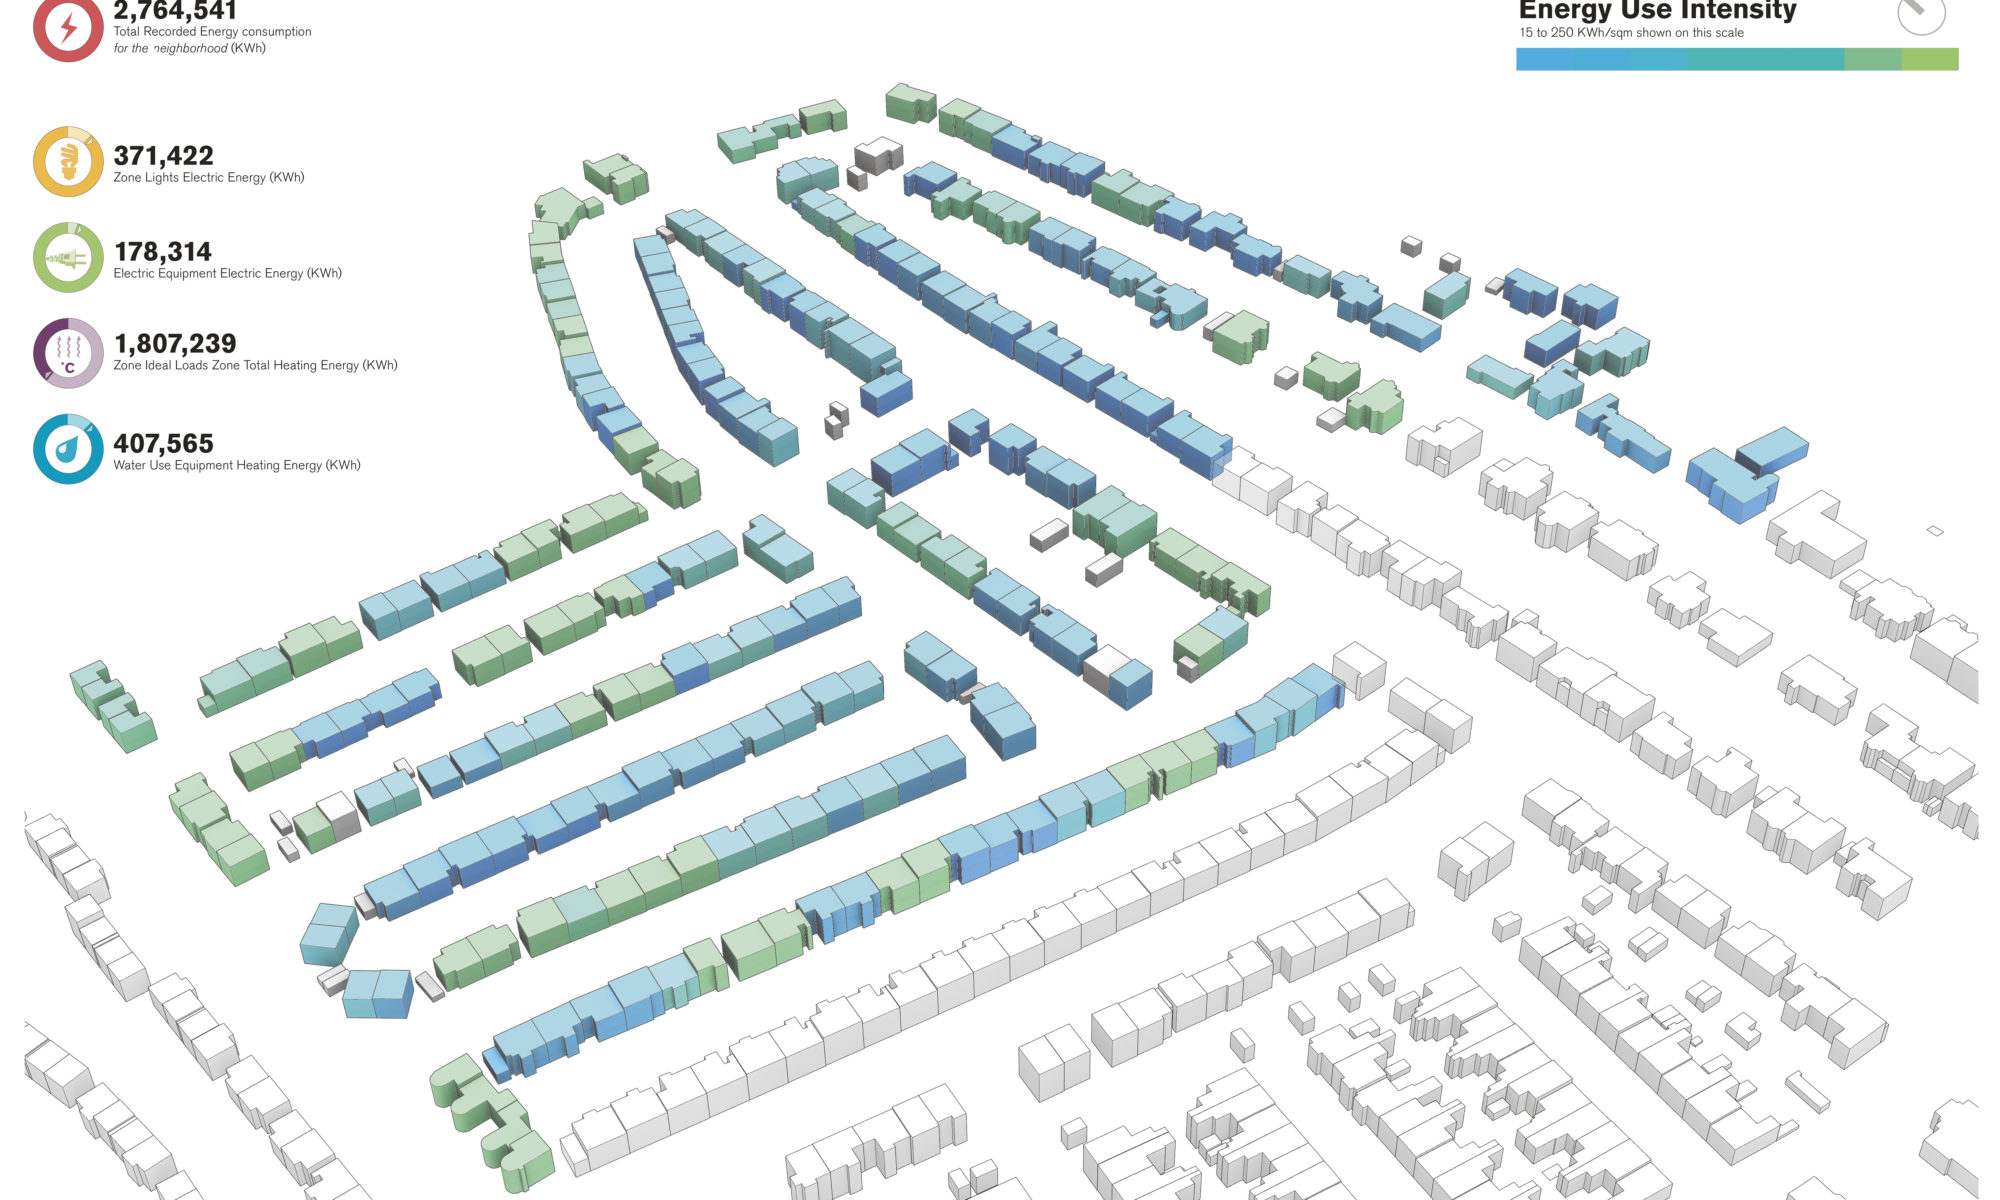
Hourly urban building energy consumption segregated per energy use: lighting, electrical equipment, heating and domestic hot water. The recorded model output emphasizes the spatio-temporal resolution of the applied energy modelling framework. First, results can be read at a building, group of buildings and neighbourhood scale. Second, energy consumptions can be read hourly, weekly, monthly and annually.
A neighbourhood of 248 domestic buildings located in north-east England, UK.
5A
- Lodging/Residential
SIMULATION PROCESS SECTION
How to integrate accessible urban building data in a comprehensive energy modelling framework? How to simulate energy consumption of current building stock at a reasonable level of detail and accuracy to investigate the feasibility of potential urban energy scenarios to build the city of tomorrow? What defines the existing energy modelling approaches and how to combine them in a comprehensive modelling framework?
- University
- EnergyPlus
- Grasshopper Honeybee
- Grasshopper ArchSim
- Post Occupancy
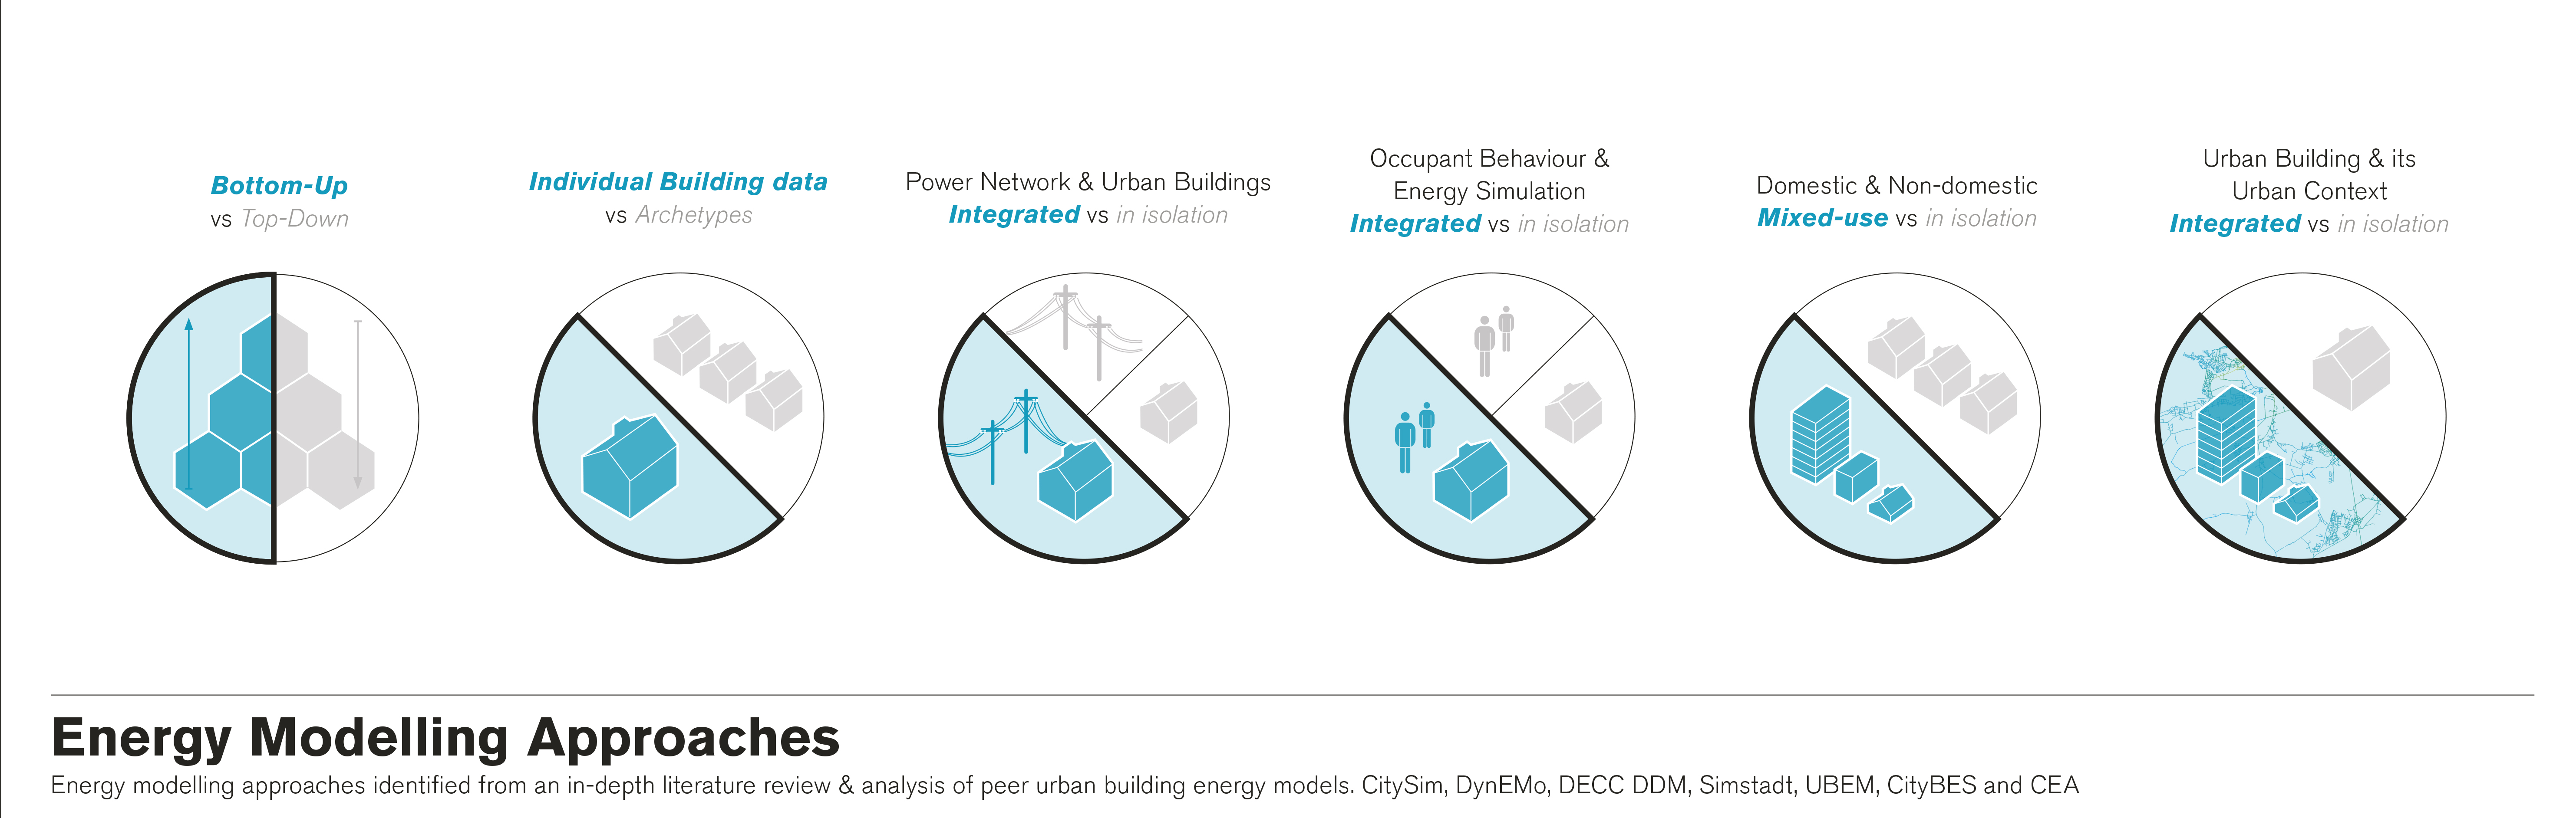
The research output is comprehensive energy modelling framework to empower planning teams with methods and tools necessary to understand patterns of energy use and to define policies/guidelines in hopes of improving the efficiency of the existing building stock. Also, to support local decision-makers with methods and tools to investigate the feasibility of potential urban energy scenarios to build the city of tomorrow. Example scenarios include optimised demand-response, building stock envelope retrofit, renewable energy generation potential, power infrastructure retrofit, heat electrification, and others. The framework was developed throughout an iterative process in a way to reach a balanced trade-off between the complexity of the simulation input and the quality of the recorded output. The framework spans not only different disciplines, but also the levels and system boundaries of analysis, i.e. Individual to aggregated consumption patterns and behaviour, the element of time to dynamically link demand and supply, and the element of space to connect the building to its urban context. This study is one step closer to integrating engineering simulation and planning methods in a multi-scale urban energy workflow.
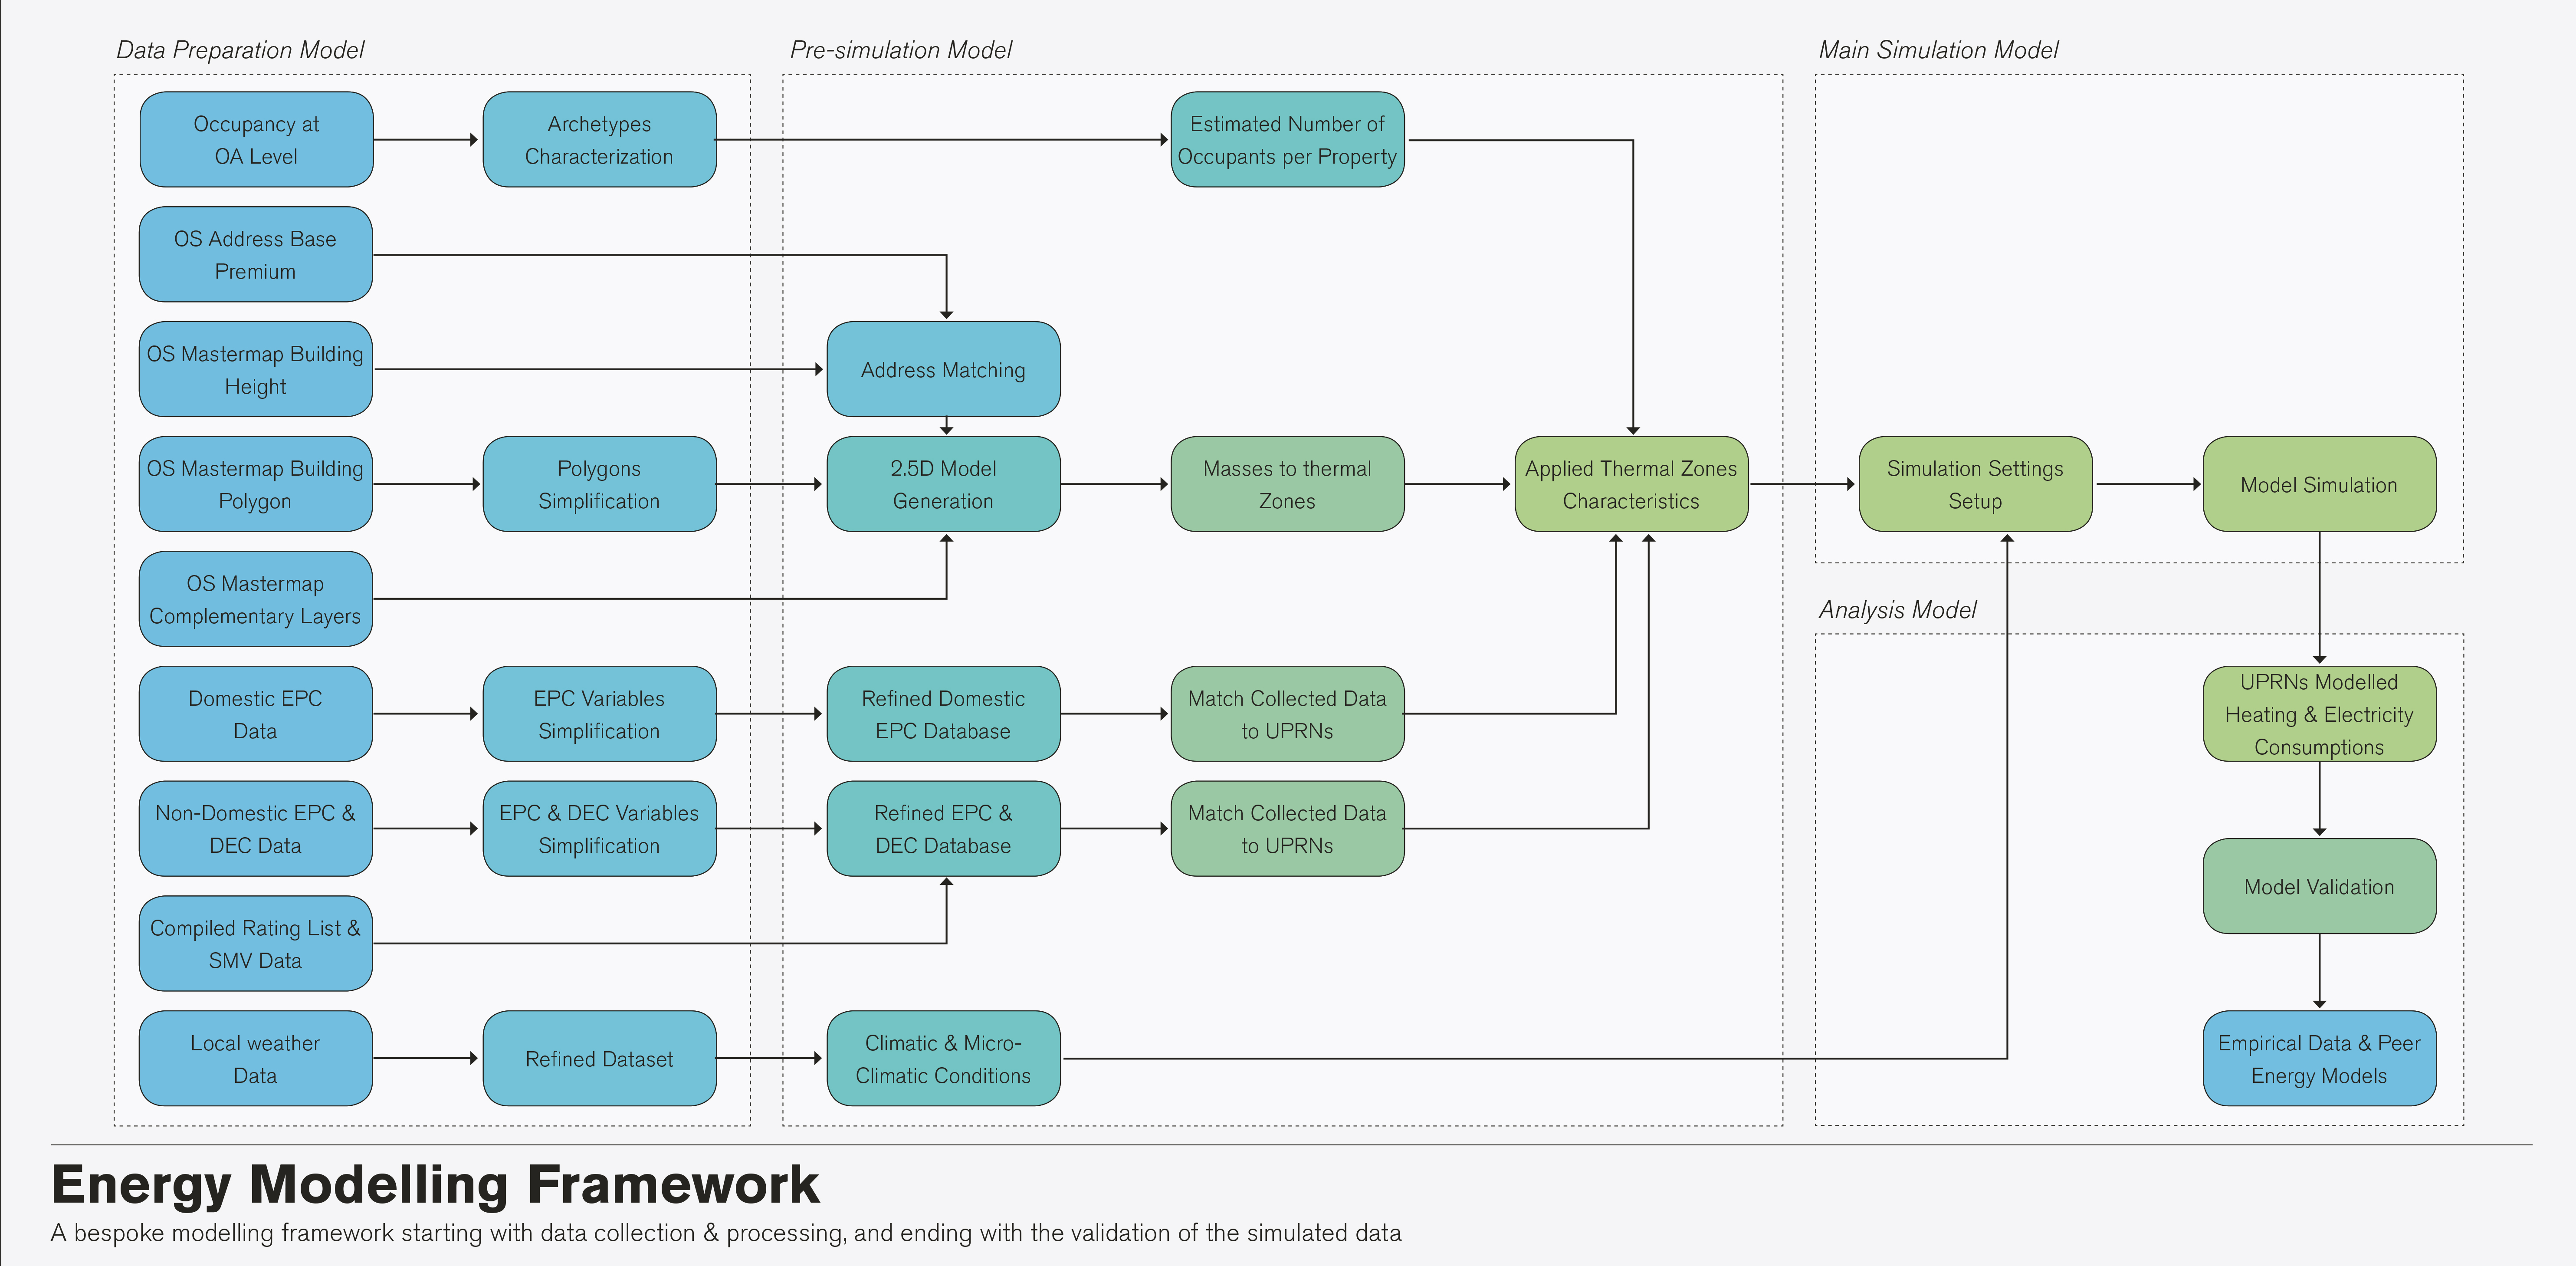
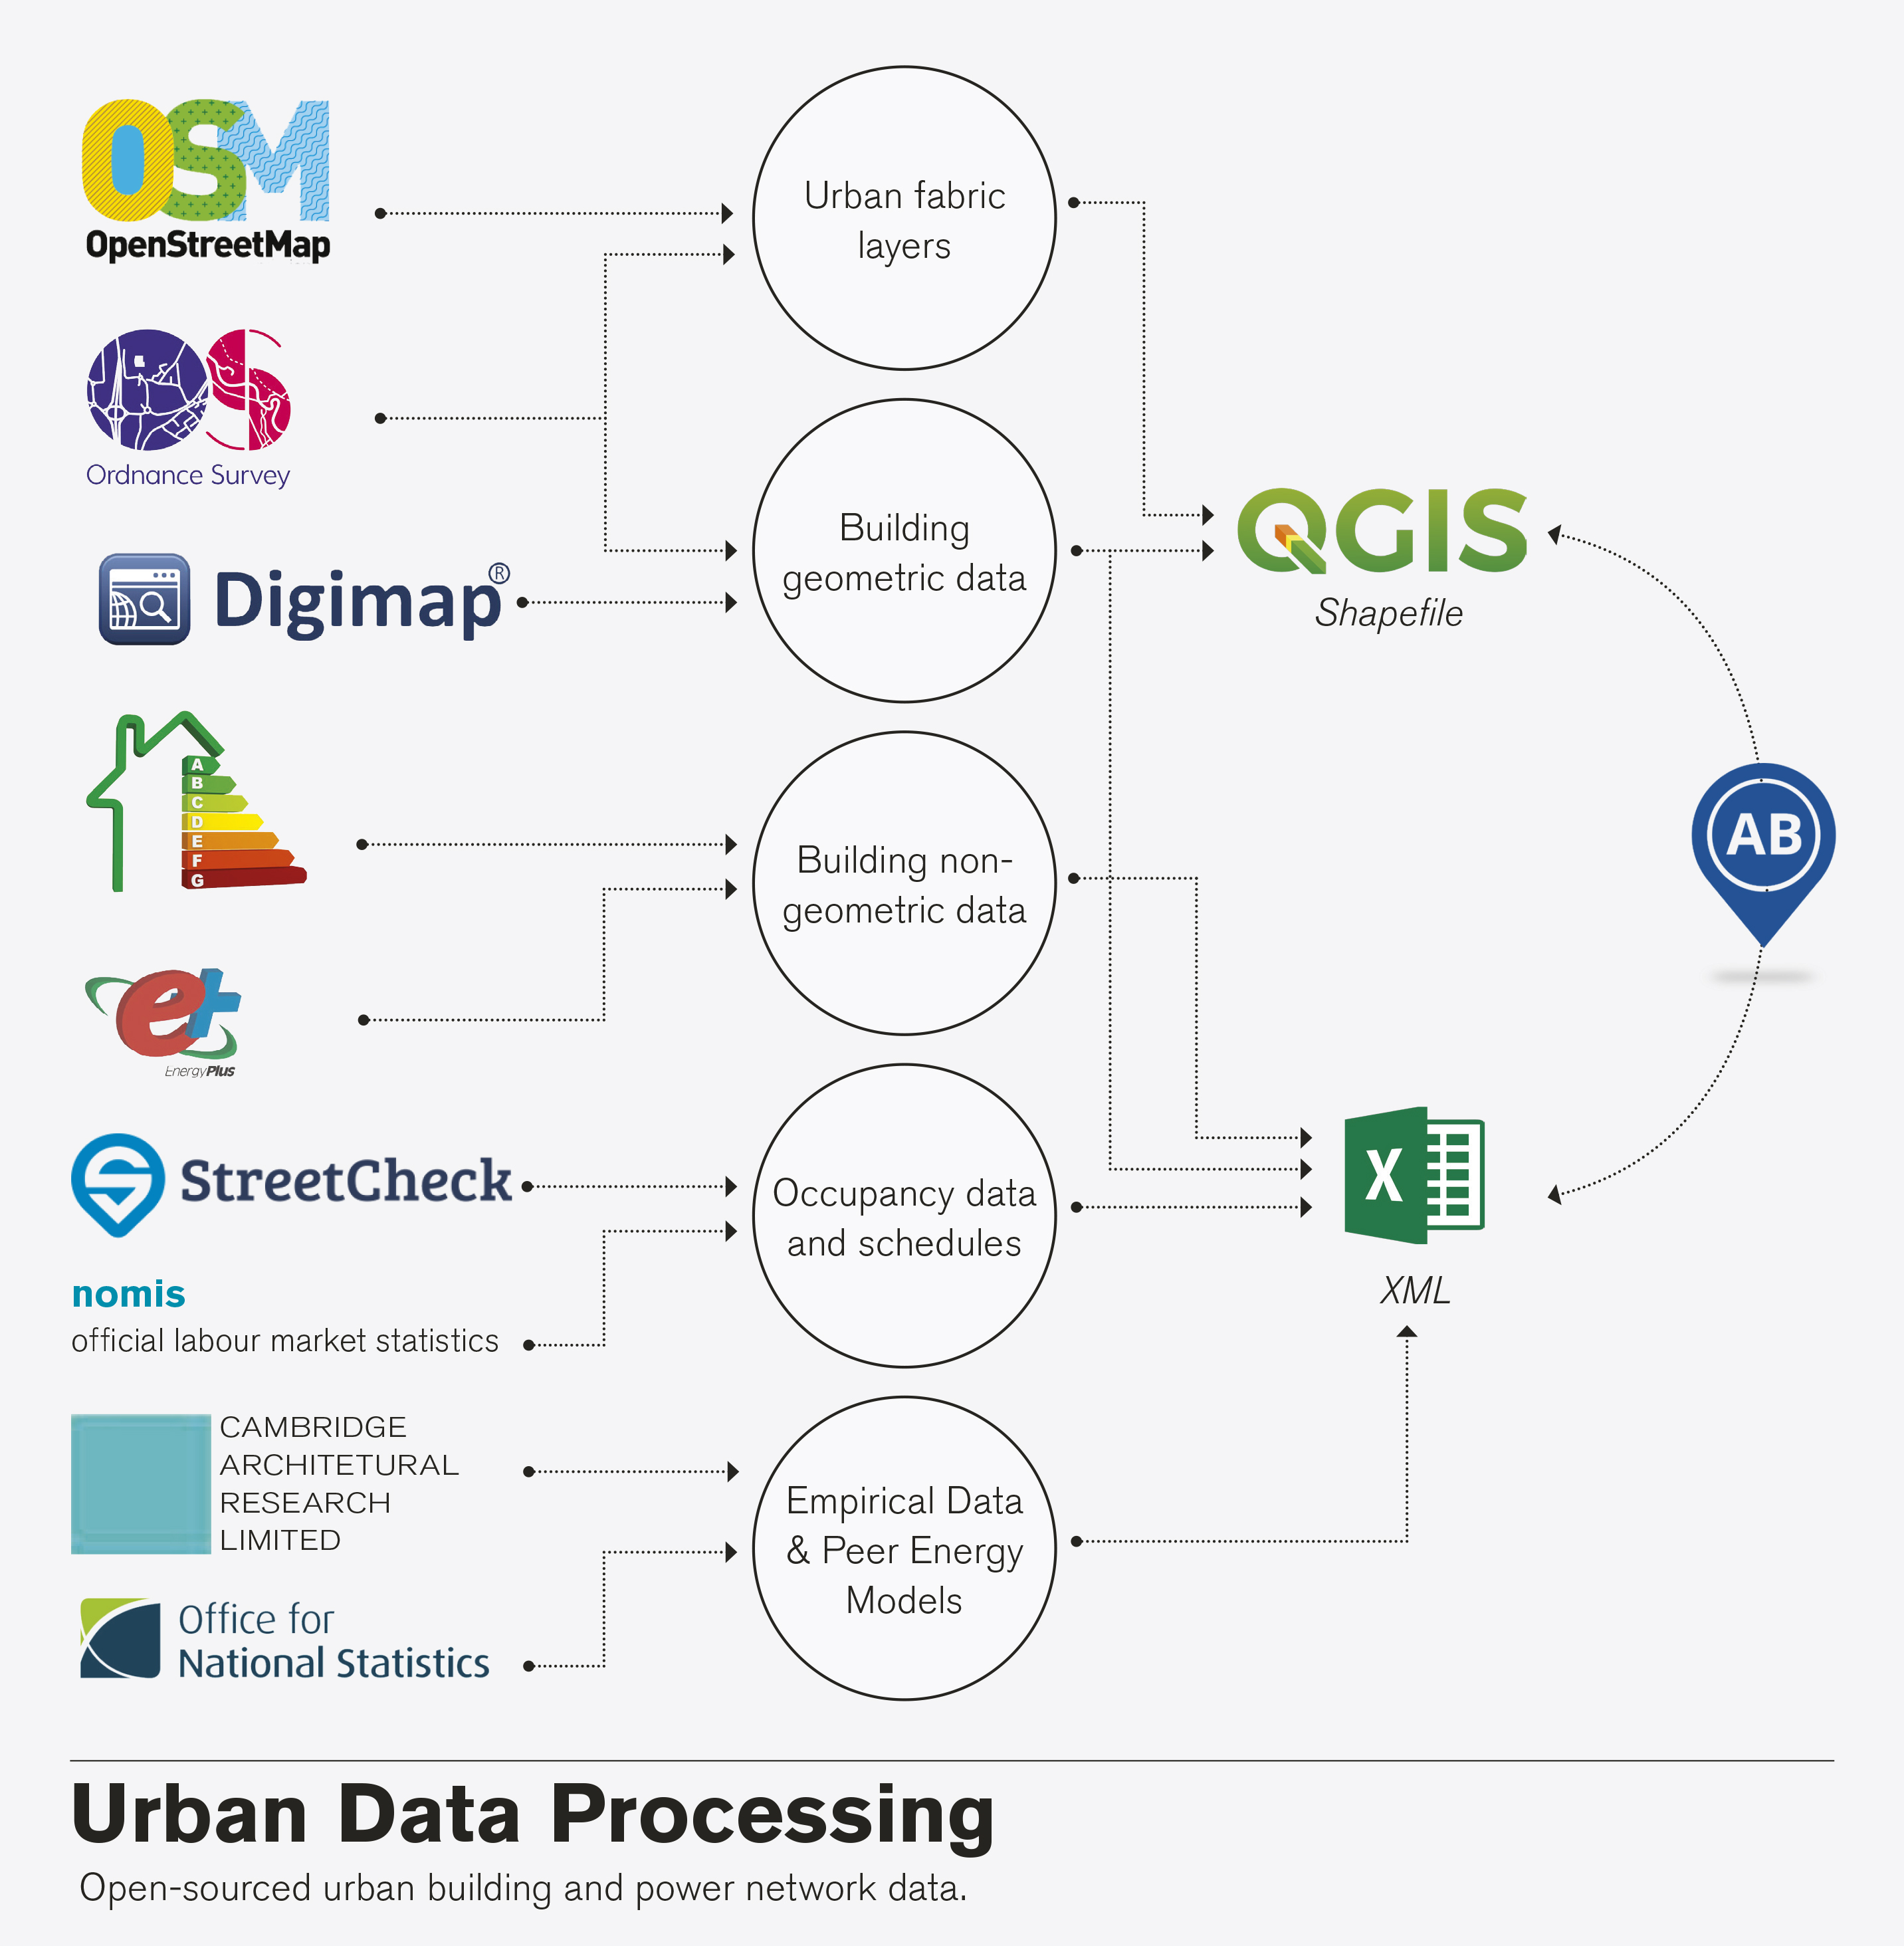
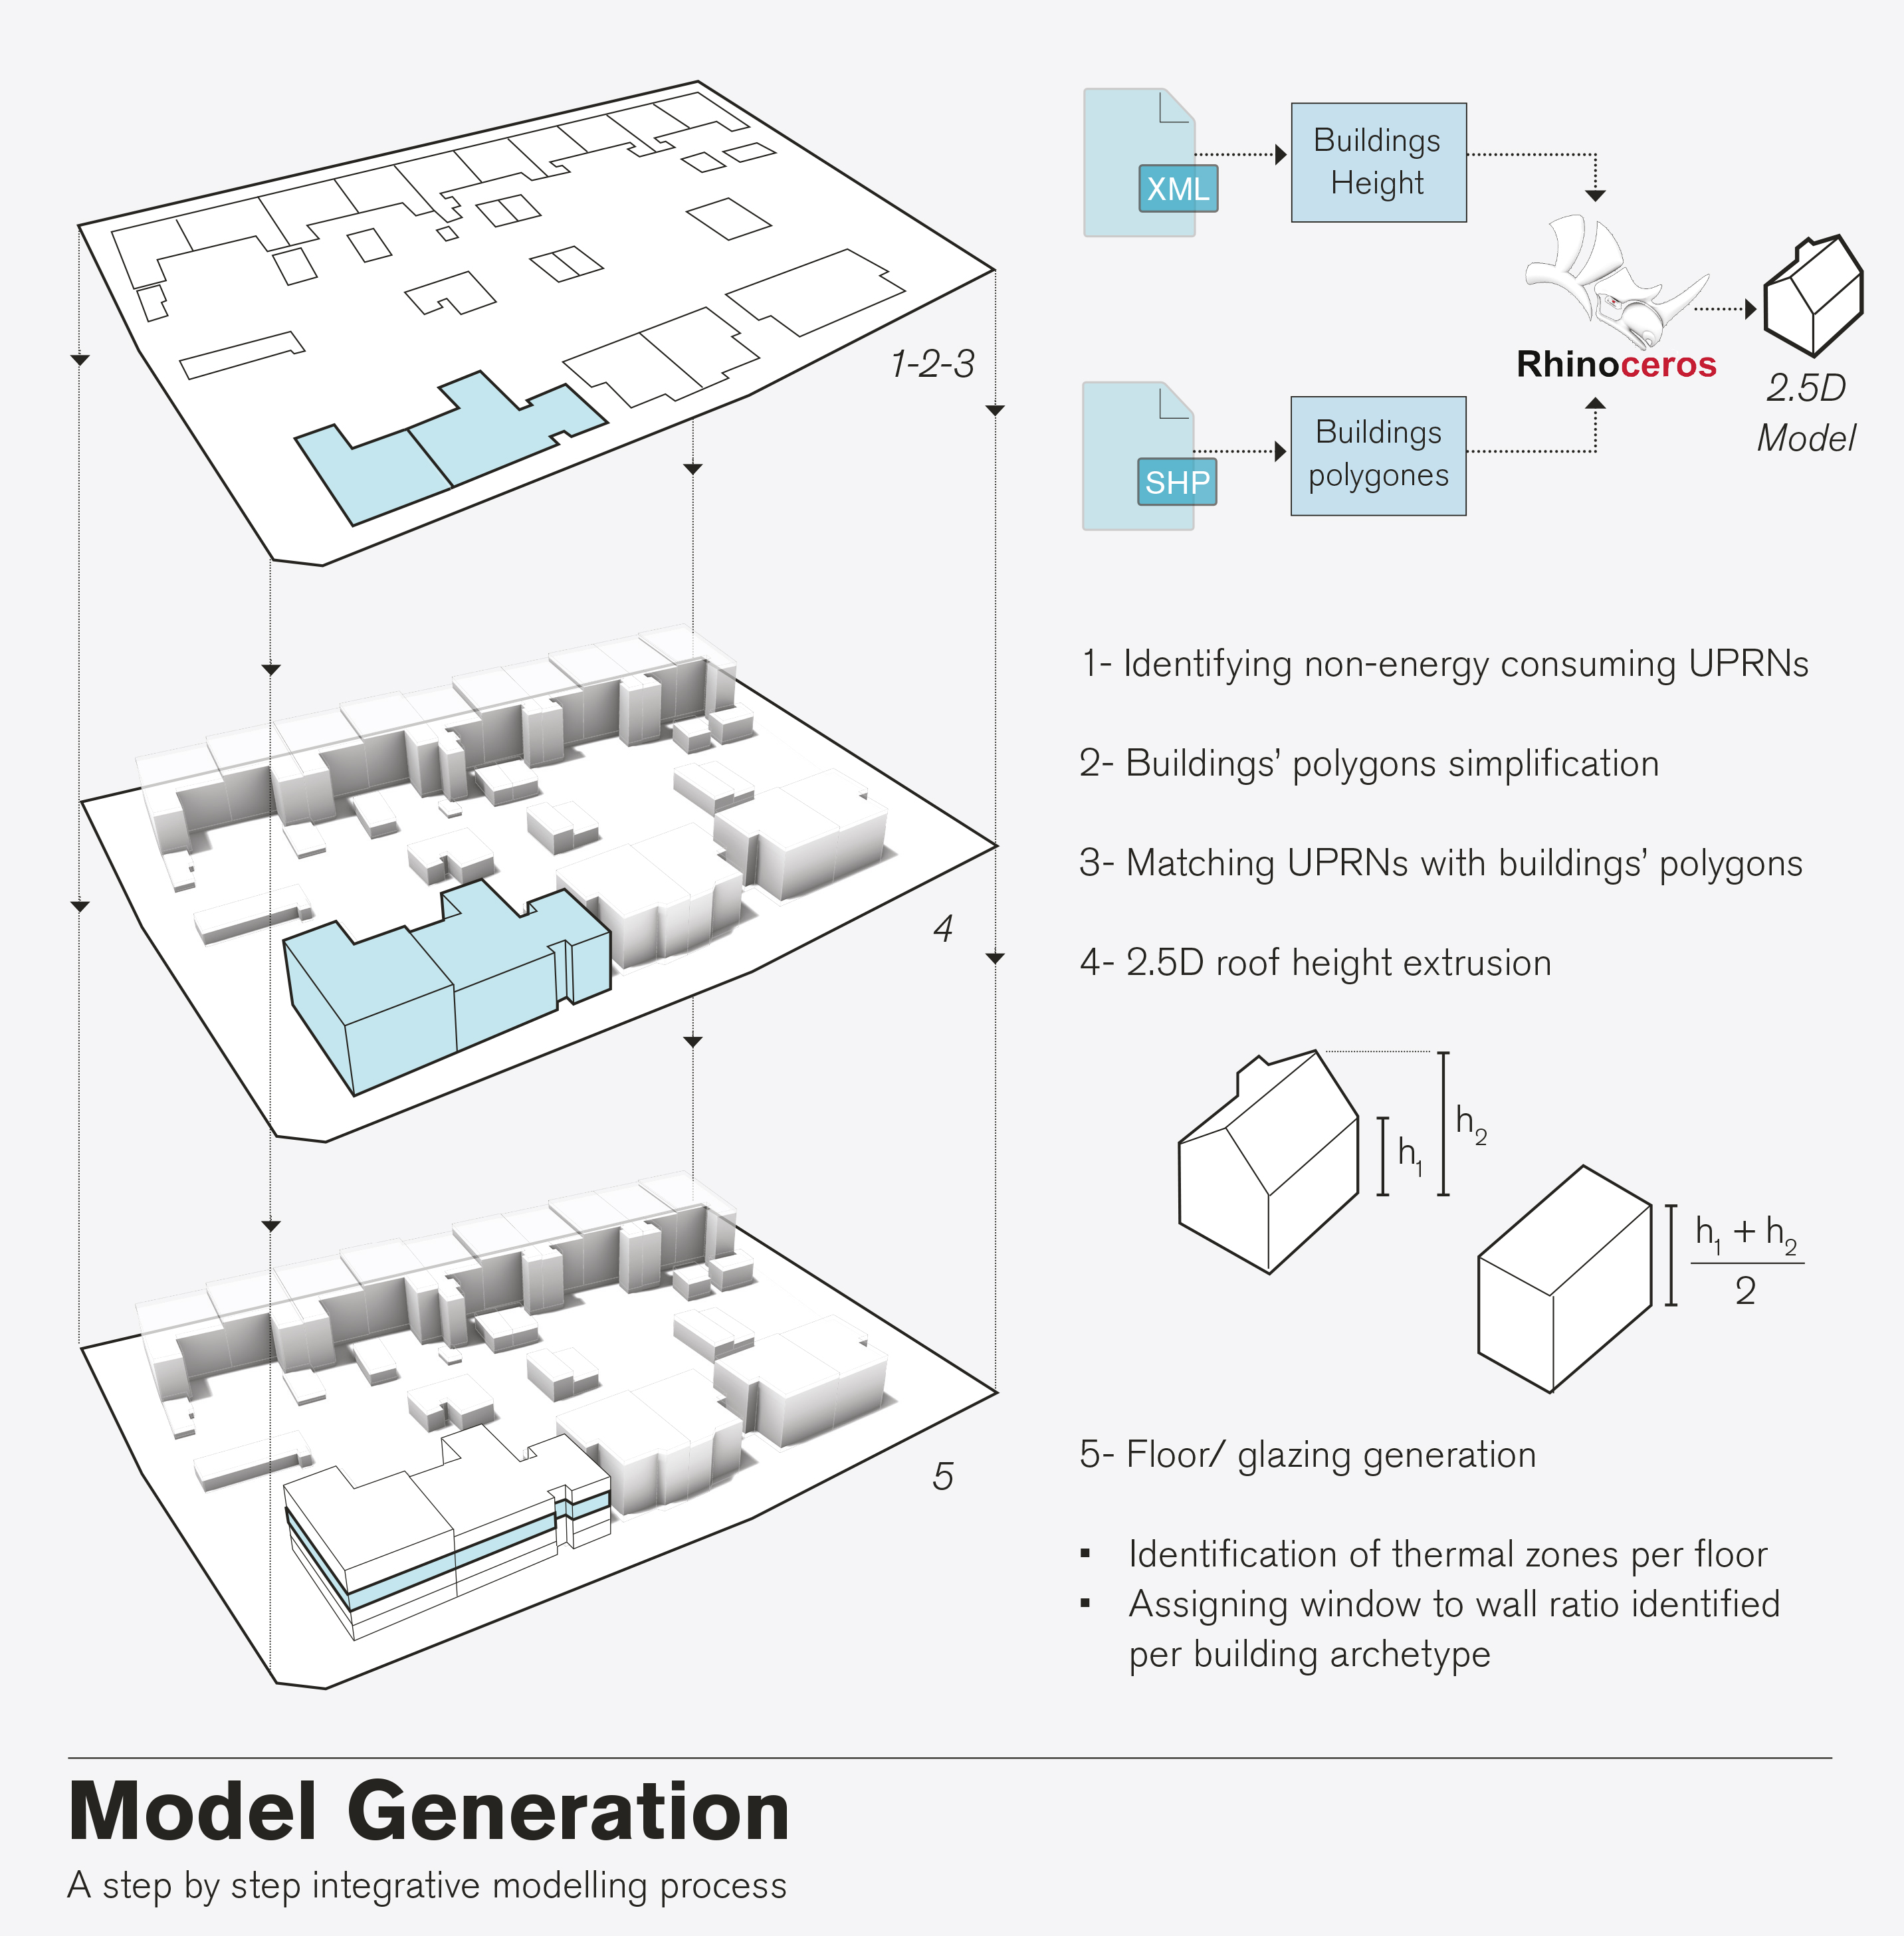
The energy modelling framework was tested on a low voltage substation neighbourhood of 248 domestic buildings located in north-east England, UK. The recorded output was then validated against open-sourced empirical data and peer energy models with an acceptable overall range of error (C. Reinhart & C. Davila, 2015). Predominantly the proposed modelling system runs on the Grasshopper platform, mainly honeybee, ArchSim, and energy plus. Complementary used platforms are QGIS 2.18, and Microsoft Excel. The proposed modelling framework is relatively user-friendly and supposedly can be used by a non-programmer. However, basic knowledge of the programmes in use is required. The methodology distinguished between several steps necessary to set up the simulation analysis: urban data processing, model characterization, model generation, model pre-simulation, energy simulation tool, results validation and in the end model calibration. The model system uses urban data from various publicly accessible sources as its input, integrates and refines them into a new dataset essential for the pre-simulation model, provides the resulting data to the main simulation model, then visualises, validates and allow calibration of the simulated energy output. The modelling system structure and its data flow diagram is depicted in the attached images.
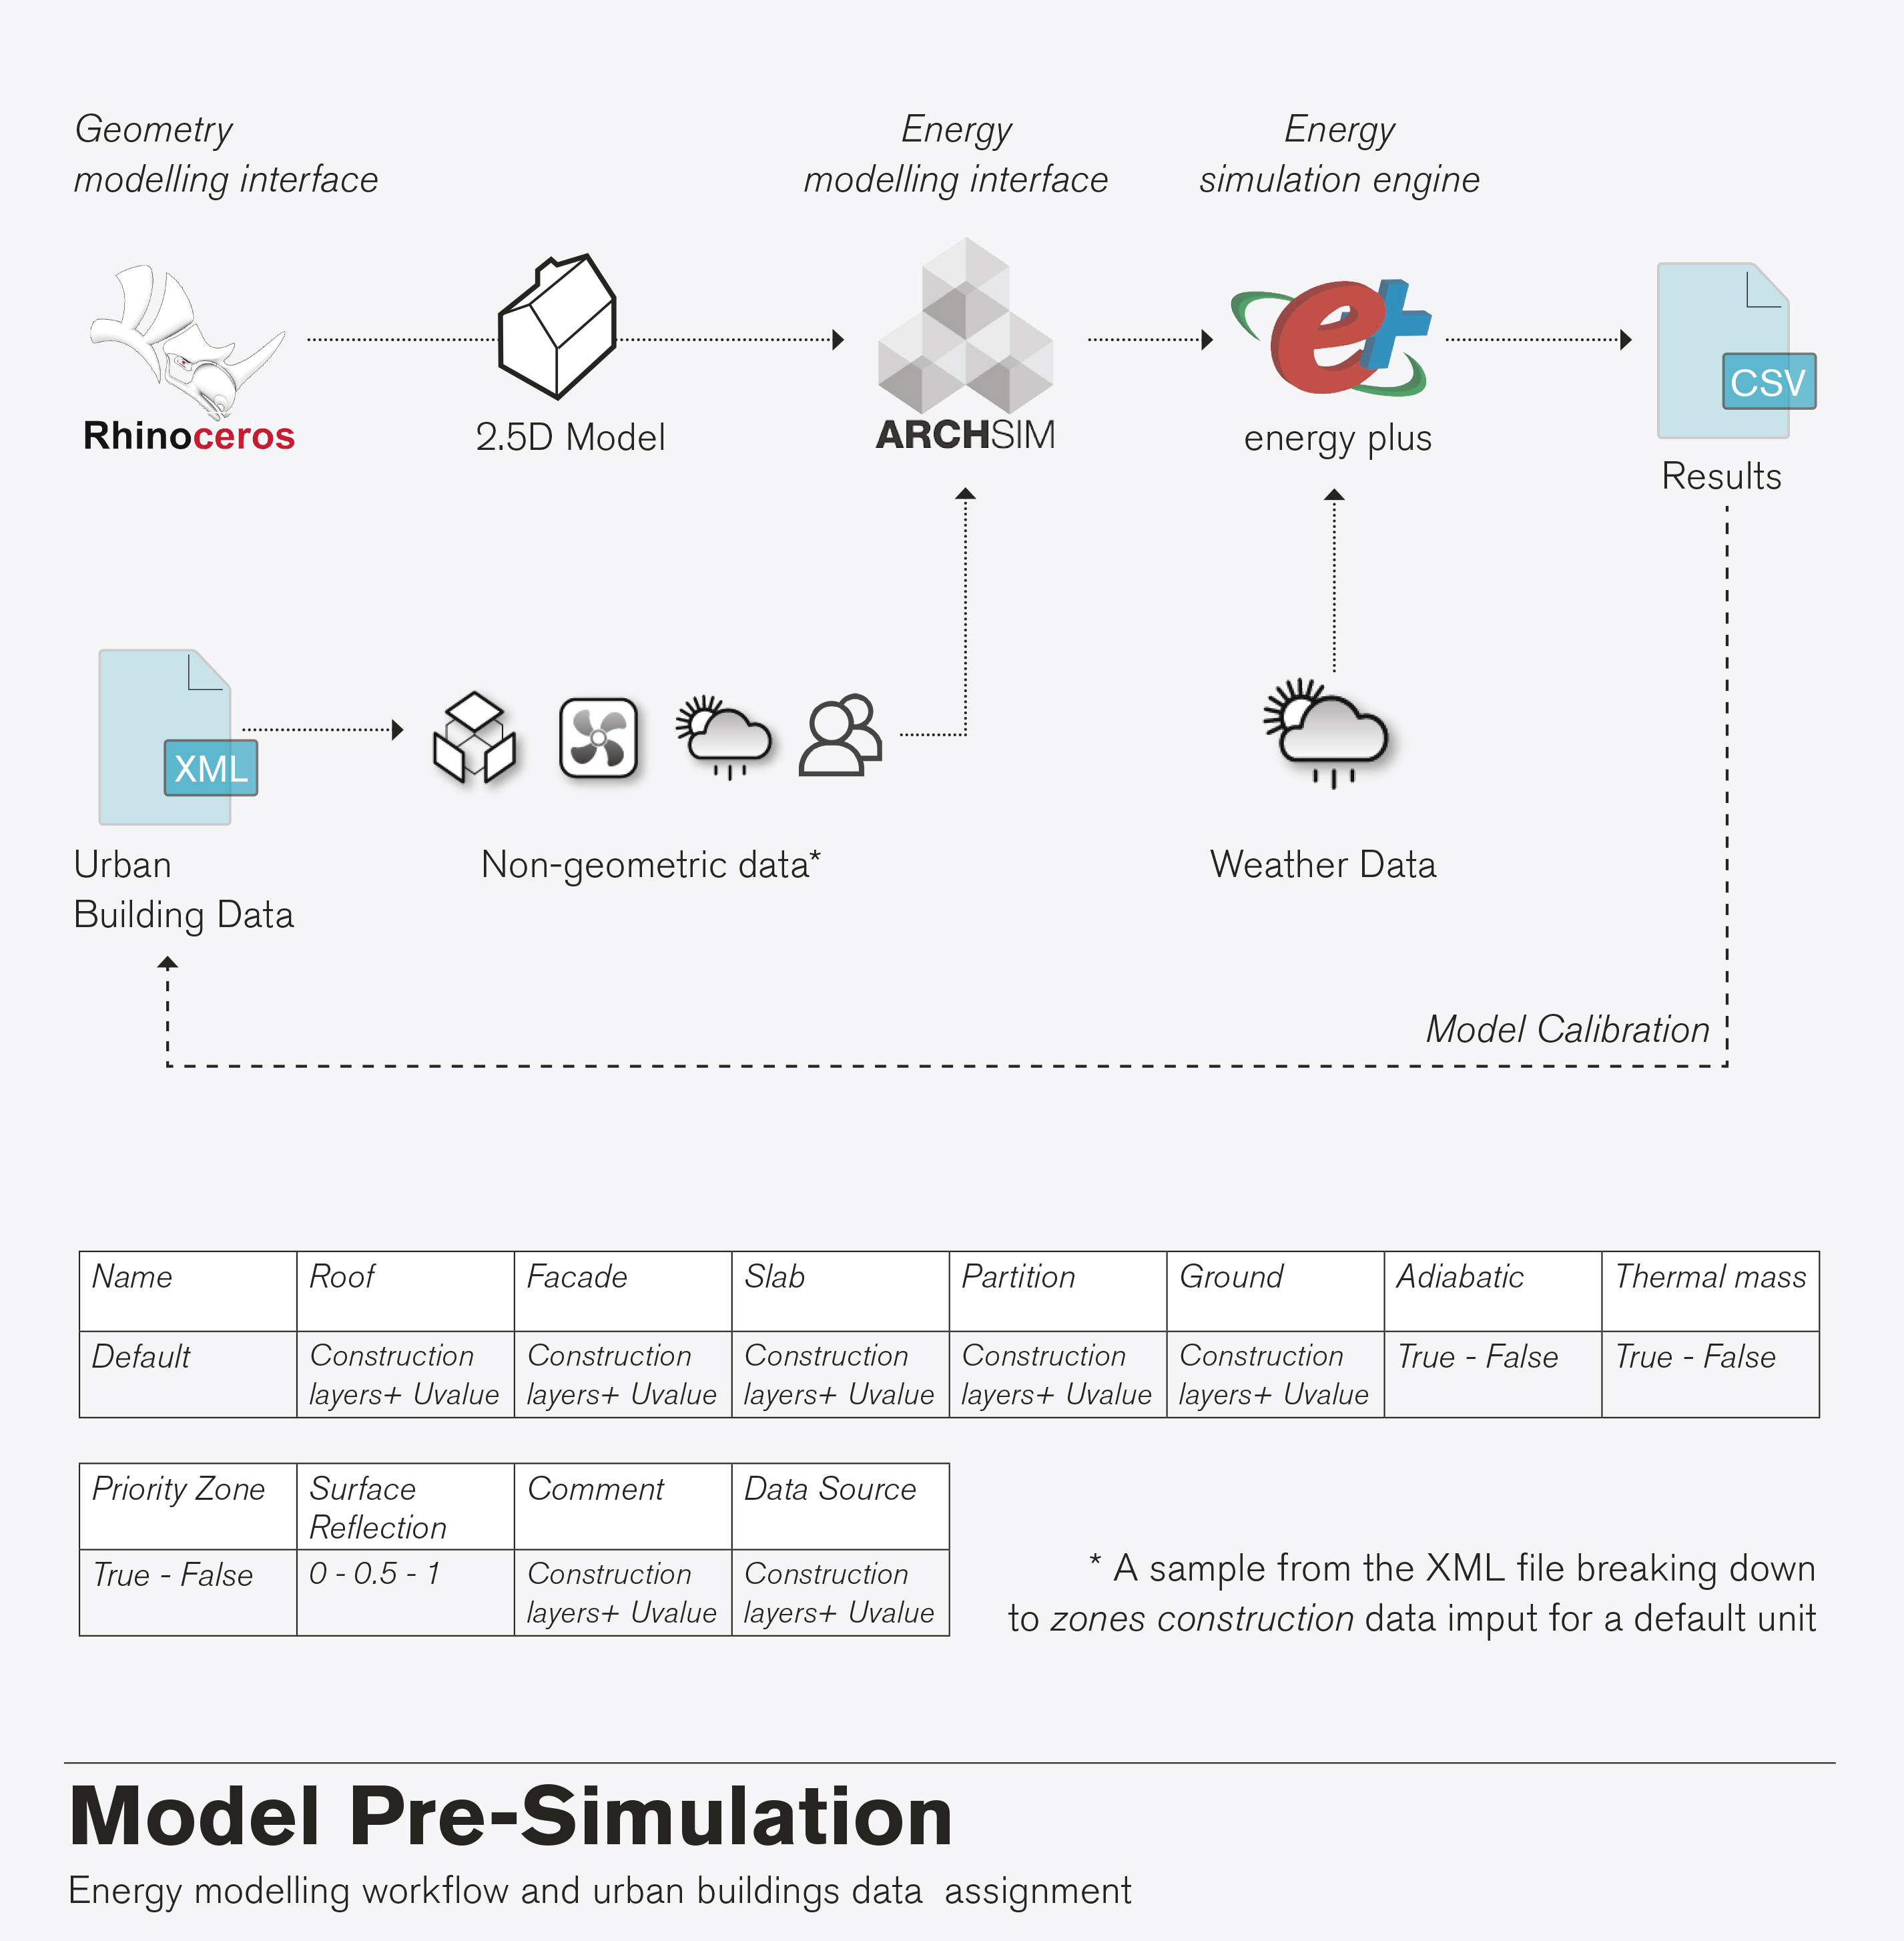
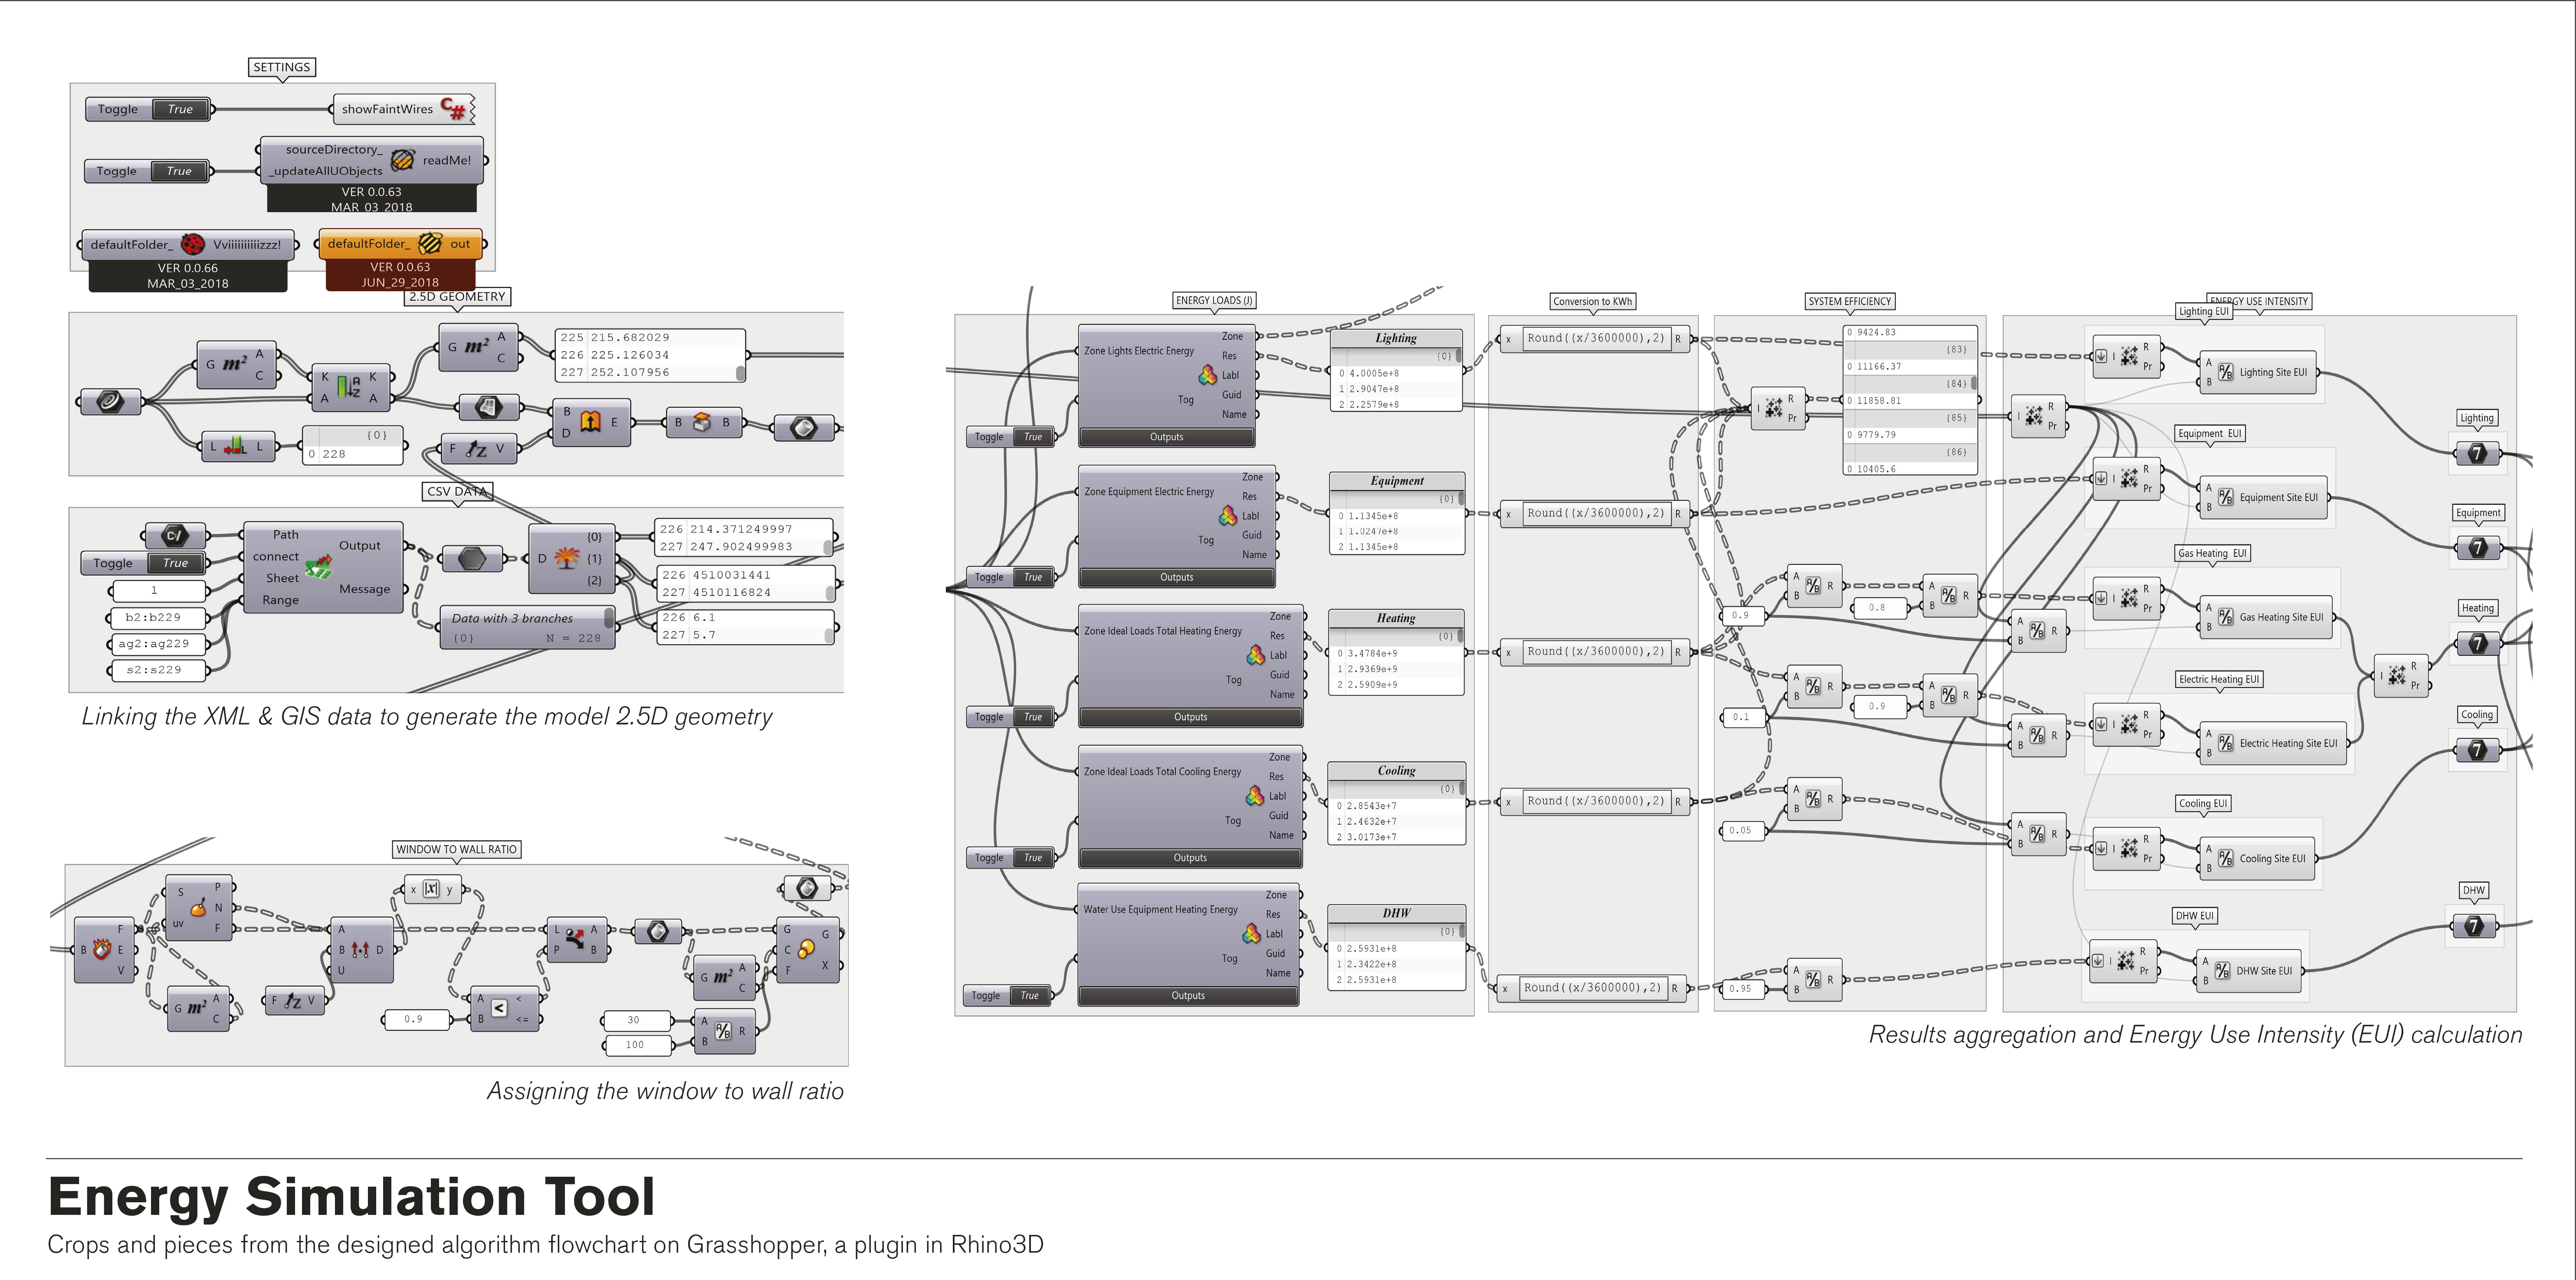

The simulated results can be segregated in four energy streams: lighting, electrical equipment, heating, and domestic hot water. The recorded model output emphasizes the Spatio-temporal resolution of the applied energy modelling framework. First, results can be read at a building, group of buildings and neighbourhood scale. Second, energy consumptions can be read hourly, weekly, monthly and annually. The recorded simulation output is saved in a CSV format which then feeds into the original XML building input data. This allows for model calibration. Results can be visualised on any type of analytical diagrams available in excel (bar charts, tables, pie charts …). Another effective way to visualise such a complex set of data can be achieved by using grasshopper/ Rhino 3D. This allows to map the simulated energy numbers on the 3D modelled neighbourhood itself and this goes along a customised energy use legend. This graphical representation can capture the Spatio-temporal resolution of the designed energy modelling framework. This proved to be a powerful graphical output to communicate scientific data to a wider range of involved stakeholders which might include non-scientific audiences.


Most importantly, what did you learn from the investigation? How did the simulation and its outputs influence the design of the project? Large urban building datasets are confusing, yet, highly valuable. The presented work dilutes this data in a comprehensive modelling framework, a framework that helps to scrutinise energy consumption patterns of the existing urban building stock. The framework results in a tool of low complexity, high reliability and suitable for multi-scale energy analysis on a neighbourhood/ LV substation area scale. The framework spans not only different disciplines but also the levels and system boundaries of analysis. What mainly characterise the designed framework is the following: a) Urban context sensitive: the modelling takes the influence of urban context into account; b) Urban data-driven: the modelling framework input utilizes abundant publicly accessible urban data to inform building energy modelling; c) Four different streams of simulated energy consumptions: Lighting, electrical equipment, heating, and domestic hot water; d) GIS and Grasshopper based: it is based on widely used software by planners and architects which makes it easier for people with non-programming background to run the model and visualize the results; f) Resolution controlled: the temporal resolution of the modelling could be changed to provide hourly, daily, weekly, monthly or annual building energy use results. Also, high spatial resolution is emphasised as results can be read at a building, group of buildings and neighbourhood scales; g) Results validated against open-sourced empirical data and peer energy models with an acceptable overall range of error (C. Reinhart & C. Davila, 2015); h) The recorded output is in CSV format which then feeds into the original XML building input data; thus, allows for model calibration; i) Final results are illustrated in a user-friendly graphical output which can capture the Spatio-temporal resolution of the designed energy modelling framework. This is likely to make the design decision making more efficient as multiple stakeholders, even non-scientific audiences can digest the complex simulated data. The outcome of this work paves the way to empower planning teams with methods and tools necessary to understand patterns of energy use and to define policies/guidelines in order to improve the efficiency of the existing building stock. Also, to support local decision-makers with methods and tools to investigate the feasibility of potential urban energy scenarios to build the city of tomorrow. Example scenarios include optimised demand-response, building stock envelope retrofit, renewable energy generation potential, power infrastructure retrofit, heat electrification, and others. Future research should aim to improve the integration of urban power infrastructure within the designed energy modelling framework. Another space for improvement includes the integration of microclimatic effects. One way to achieve this is by linking Envi-met (another grasshopper plugin) to the simulation set-up workflow. Worth mentioning that the framework as designed applies to UK neighbourhoods, and further work is required to re-adjust the framework to publicly available urban data in other cities and countries. We have many life responsibilities, contributing to planning the city of tomorrow is one of them.