What is the impact of glazing selection, framing type and window-to-wall ratio on the overall thermal performance of a curtain wall system?
Olivier Brouard
Skidmore, Owings and Merrill LLP
- Olivier Brouard, Sustainability Engineering Team Leader - Stephen Ray, CFD Engineering Specialist
Project Information
Frame U-value, Center of Glass U-value, Window-to-wall ratio
Overall fenestration U-value
200,000
4A
- Office
SIMULATION PROCESS SECTION
Building performance is notably driven by Energy codes defining the minimum requirements for reaching specified objectives. Reducing cooling and heating loads calls for passive design strategies starting by the orientation of the building and notably its envelope performance driving heat transfer. Increasing requirements for energy conservation have resulted in greater consideration of the effect windows have on the overall heat losses of an external wall. The prescriptive requirements of the Beijing Energy code looks at the U-value of the assembly of the fenestration system (Glass + Frame)
- Architect - Internal Sustainability Personnel
- OpenStudio + Eplus
- Design Development
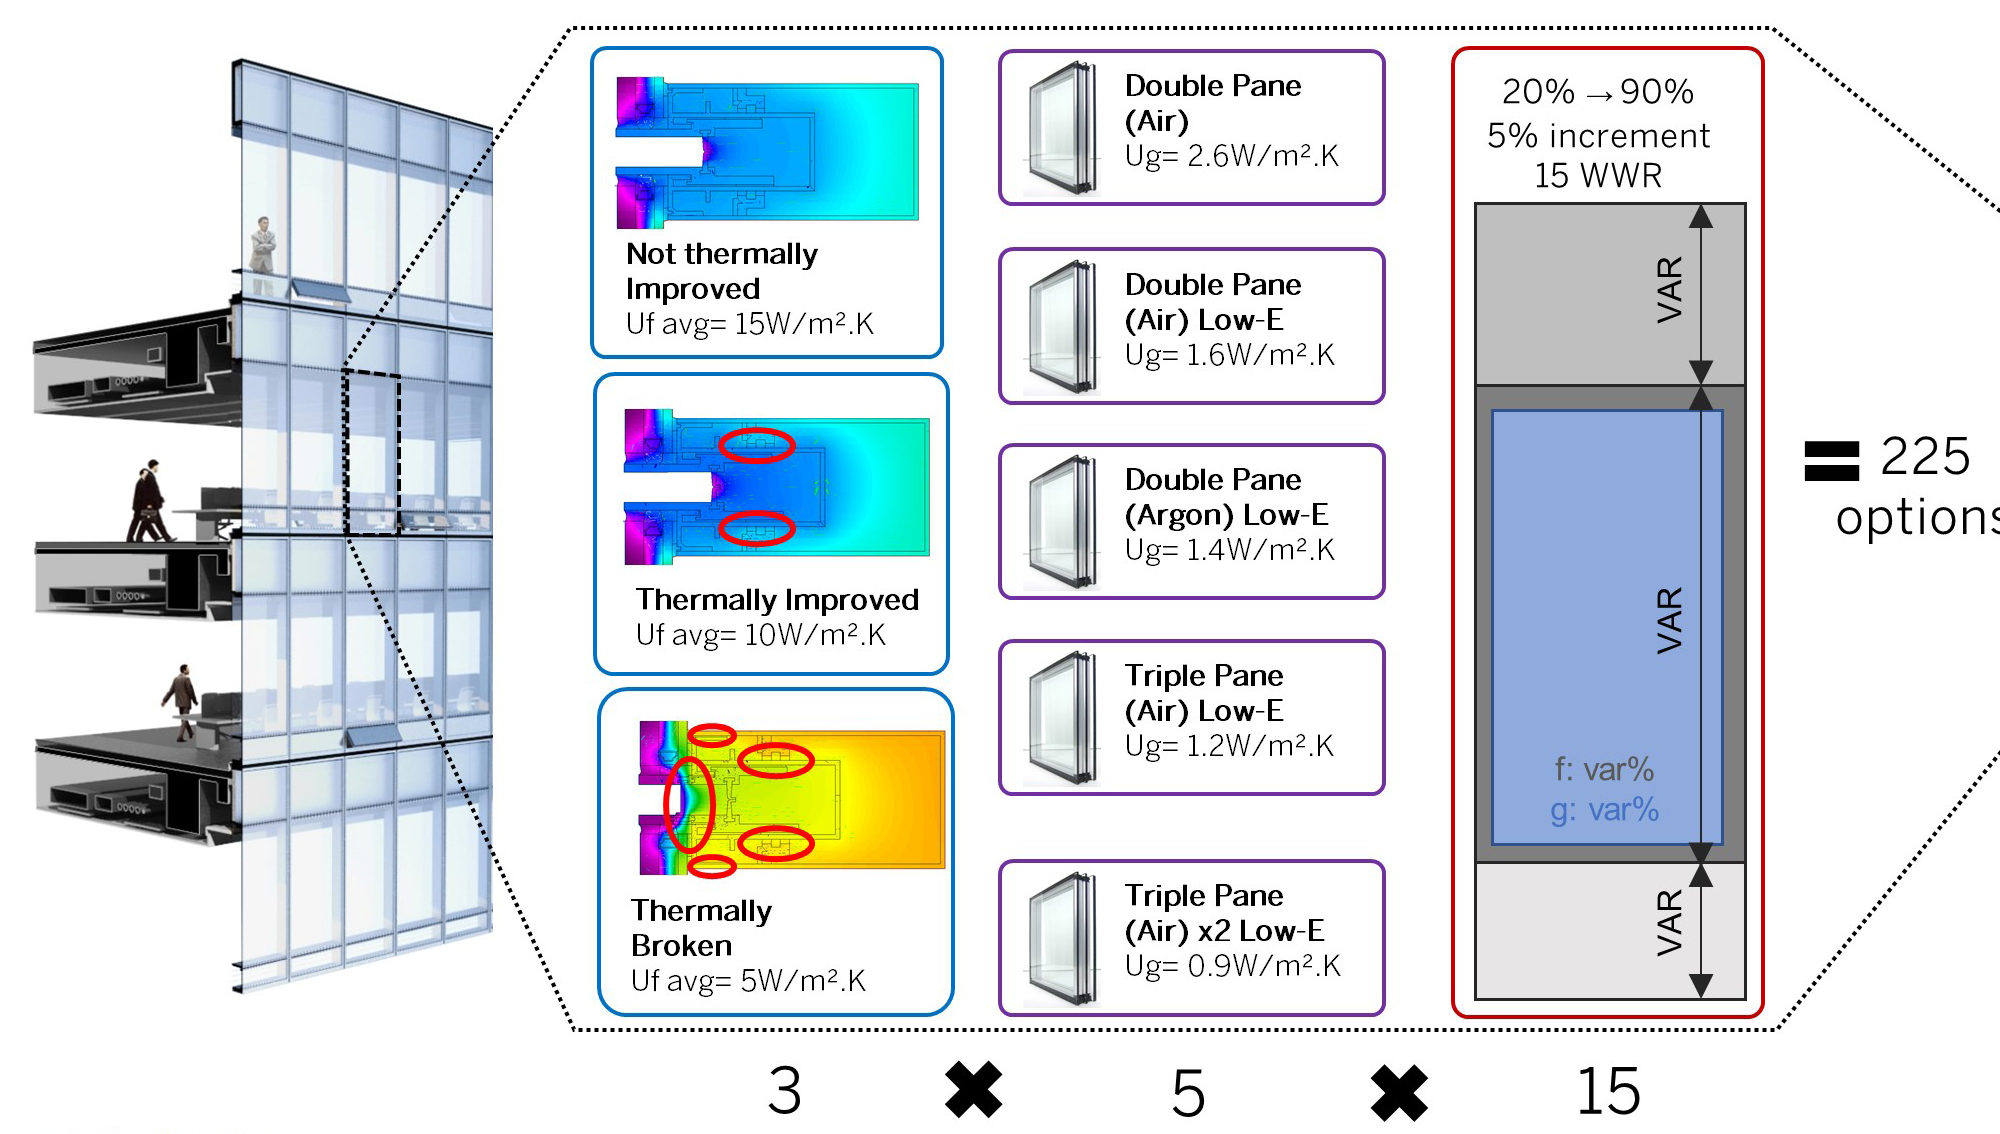
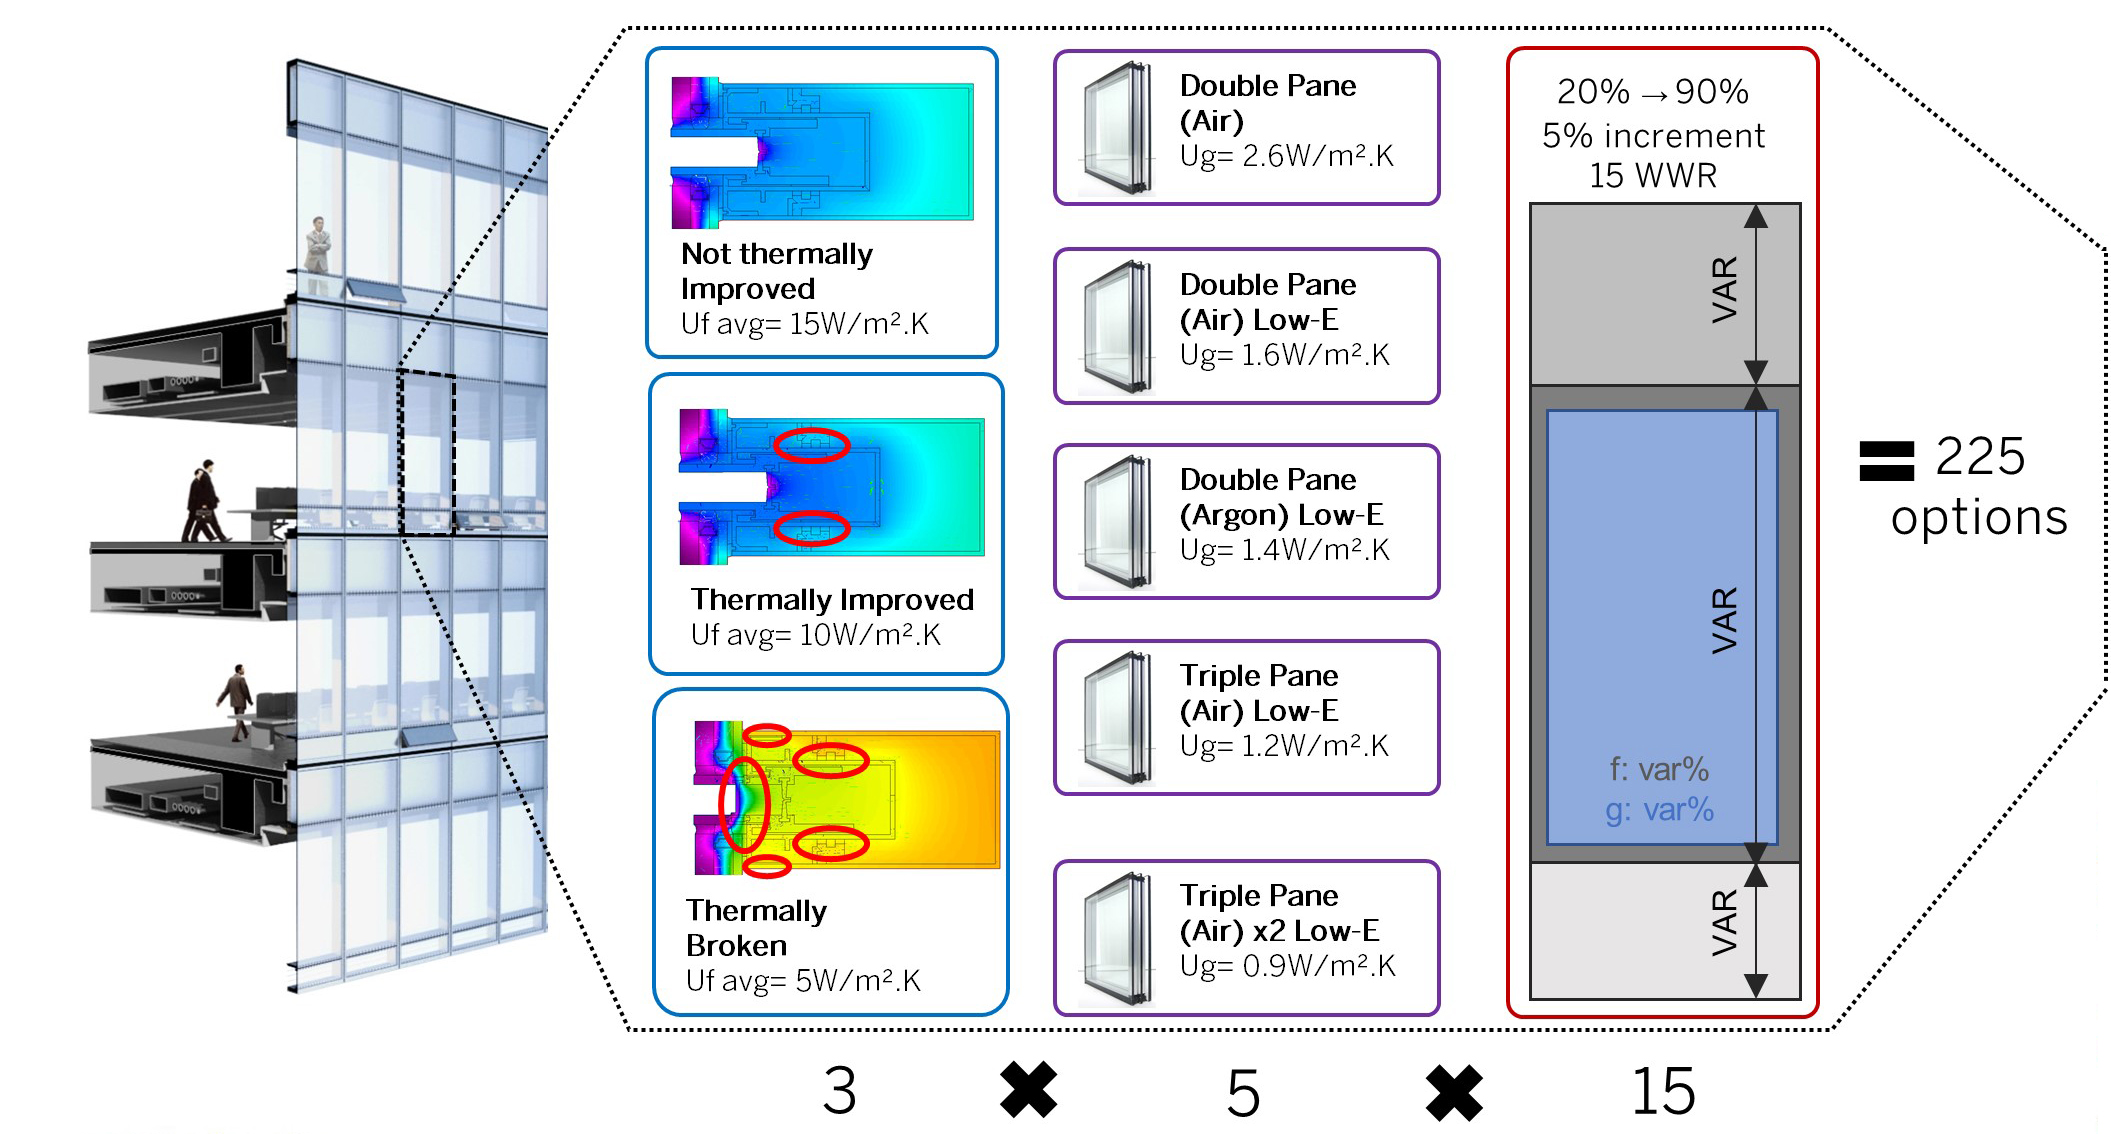
The simulation was integrated at design development when the team realized that the Beijing performance code had been updated pushing at the forefront the facade sustainability energy requirements limiting the surface of glass of the enclosure and calling for redesign. In order to avoid this to happen in the future, a tool was developed to proactively address 225 different design options from which a designer can choose from to establish a ballpark U-value fenestration number to start with.
The simulation workflow was established as follow: - Used D3 - a JavaScript library for producing dynamic, interactive data visualizations in web browsers. - Download d3.parcoords (parallel coordinates) open source code - Modify & add Functionalities to the code - Ran Therm and Window models from LBNL. - Parametrically set up an excel file to generate multiple outputs as a function of the window-to-wall ratio changing from 20% to 90% - Created an excel spreadsheet csv file with inputs and outputs - Link the database csv file to the D3 HTML code - Designed and Formatted with the firm Standard - Visualized the tool running a Javascript Node Server locally or on an intranet server
To understand the magnitude impact of design decisions very quickly and simultaneously. An interactive engaging exploration tool reading pre-run simulations Leverages high multidimensional results of large-scale dataset Customizable and optimized for storytelling. Provides real-time feedback to Design Team to highlight major findings
The selected choice for the softwares used didnt exist. The process is shown below: - Used D3 - a JavaScript library for producing dynamic, interactive data visualizations in web browsers. - Download d3.parcoords (parallel coordinates) open source code - Modify & add Functionalities to the code - Ran a Therm and Window models - Parametrically set up an excel file to generate multiple outputs as a function of the window-to-wall ratio changing from 20% to 90% - Created an excel spreadsheet csv file with inputs and outputs - Link the database csv file to the D3 HTML code - Designed and Formatted with the firm Standard - Visualized the tool running a Javascript Node Server locally or on an intranet server