What is the impact of various design strategies on design primary air flow rate of chilled beams?
Yiyuan Jia
Affiliated Engineers, Inc.
Project Information
chilled beams, fin tubes, suppress dew points, heat pipe, shading, recirculating fans
chilled beam design primary air flow rates
592
5B
- Education
- Mixed Use
Laboratory, Office
SIMULATION PROCESS SECTION
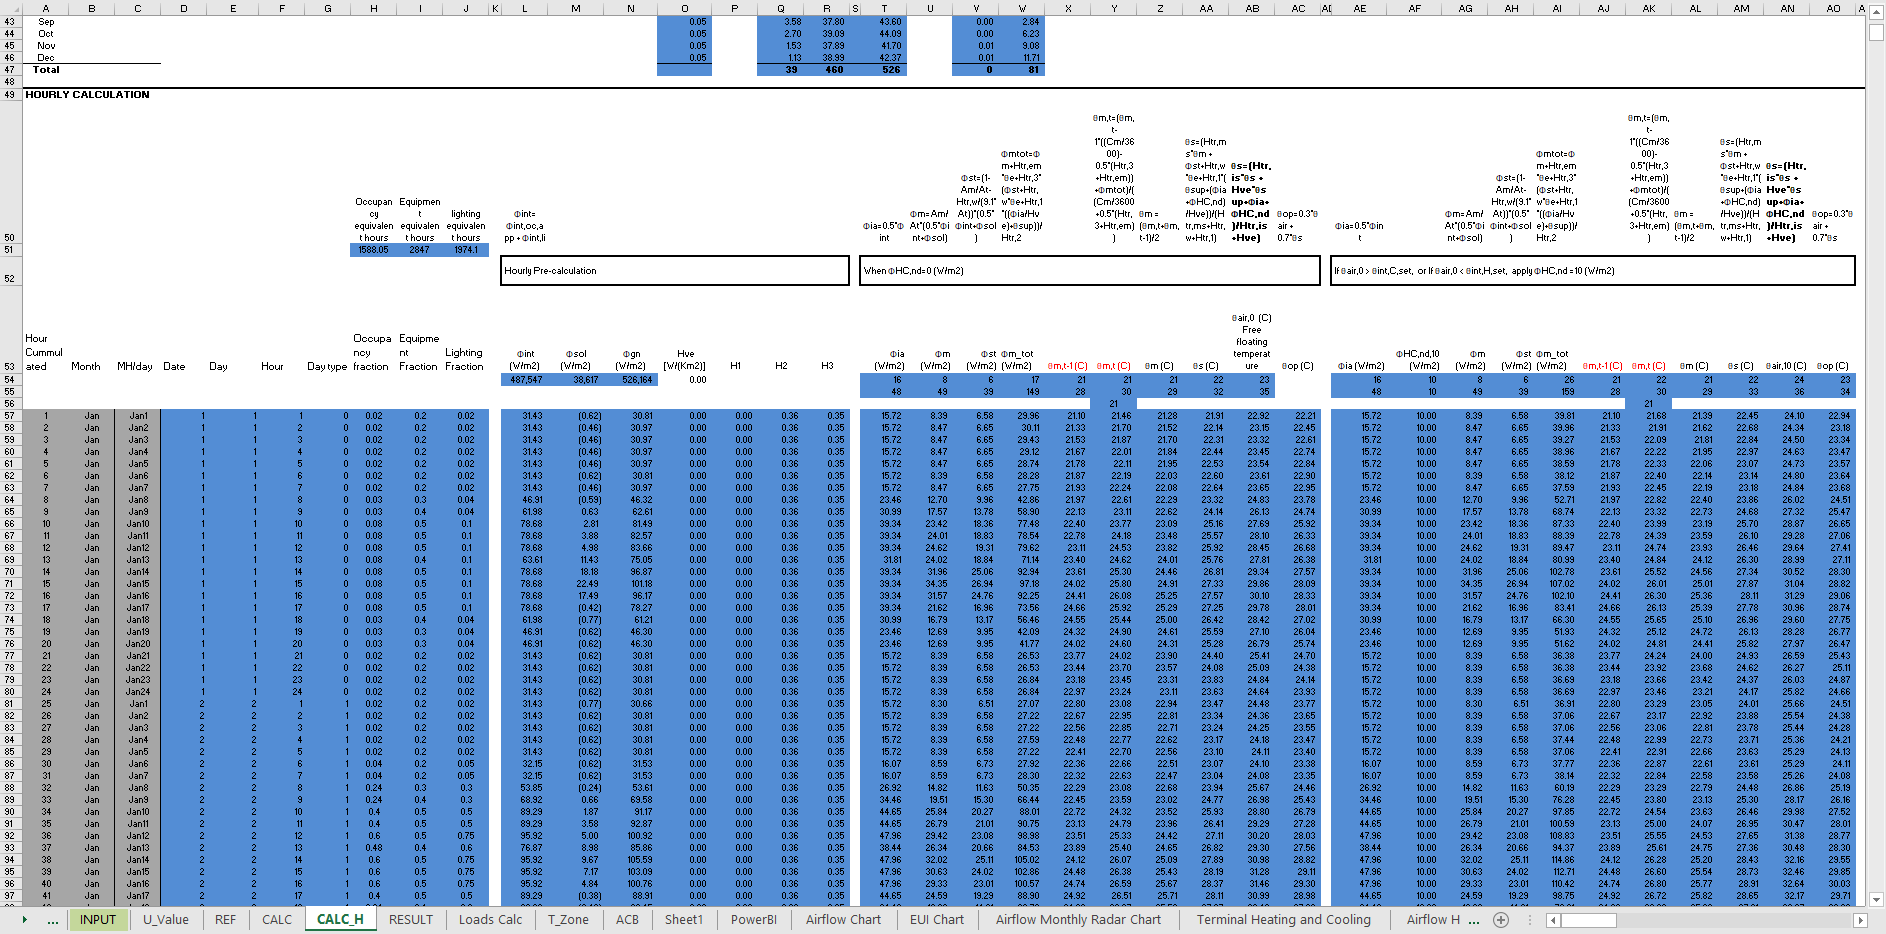
The graphics are created base on an in-house HVAC design assist tool, the 5 radar charts illustrate the design primary air flow rates driven by outdoor air, sensible cooling, sensible heating, and latent cooling accordingly. In active chilled beam (ACB) design, the outer most primary air flow in the radar chart would anchor the design primary air flow rate and used for equipment selection. We analyzed different strategies that would reduce the design primary air flow and leave only the ventilation air as the driver, the goal is to achieve a fully decoupled ACB system design.
- MEP Firm
- EnergyPlus
- Schematic Design
Simulations are conducted as as means to answer the "what-if" questions asked by design engineers and modeler. The goal was to reduce primary air and reduce beam sizing(in other word, cost of energy and equipment), with this in mind, multiple design strategies have been assessed through simulation.
The simulation analysis is set up in a building simulation tool called EPC, it is developed base on the ISO-13790 standard by Georgia Tech High Performance Buildings Lab, the author further developed a HVAC simulation module base on the hourly EPC calculator. The calculations in the submitted documents are conducted using the hand crafted tools.
The data was presented to the with both scatter chart and radar chart, the hourly design air flow rates drive by each load are represented with different colors. The design primary air is then anchored by the outer most dot in the radar chart and is represented as a solid circle (with the same color with the driver), as in this case the chilled beam air flow is constant.
