What is the impact of various massing shapes on the overall pEUI, cooling and heating loads of a super tall office building located in Wuhan China?
Olivier Brouard
Skidmore, Owings and Merrill
- Olivier Brouard, Sustainability Engineering Team Leader - Shaily Rungta, Building Performance Analyst - Neil Katz, Daylighting Performance Specialist - Stephen Ray, CFD Specialist - Luke Leung, MEP Engineer Team Leader - Jason Kirkpatrick (Building Performance Analyst)
Project Information
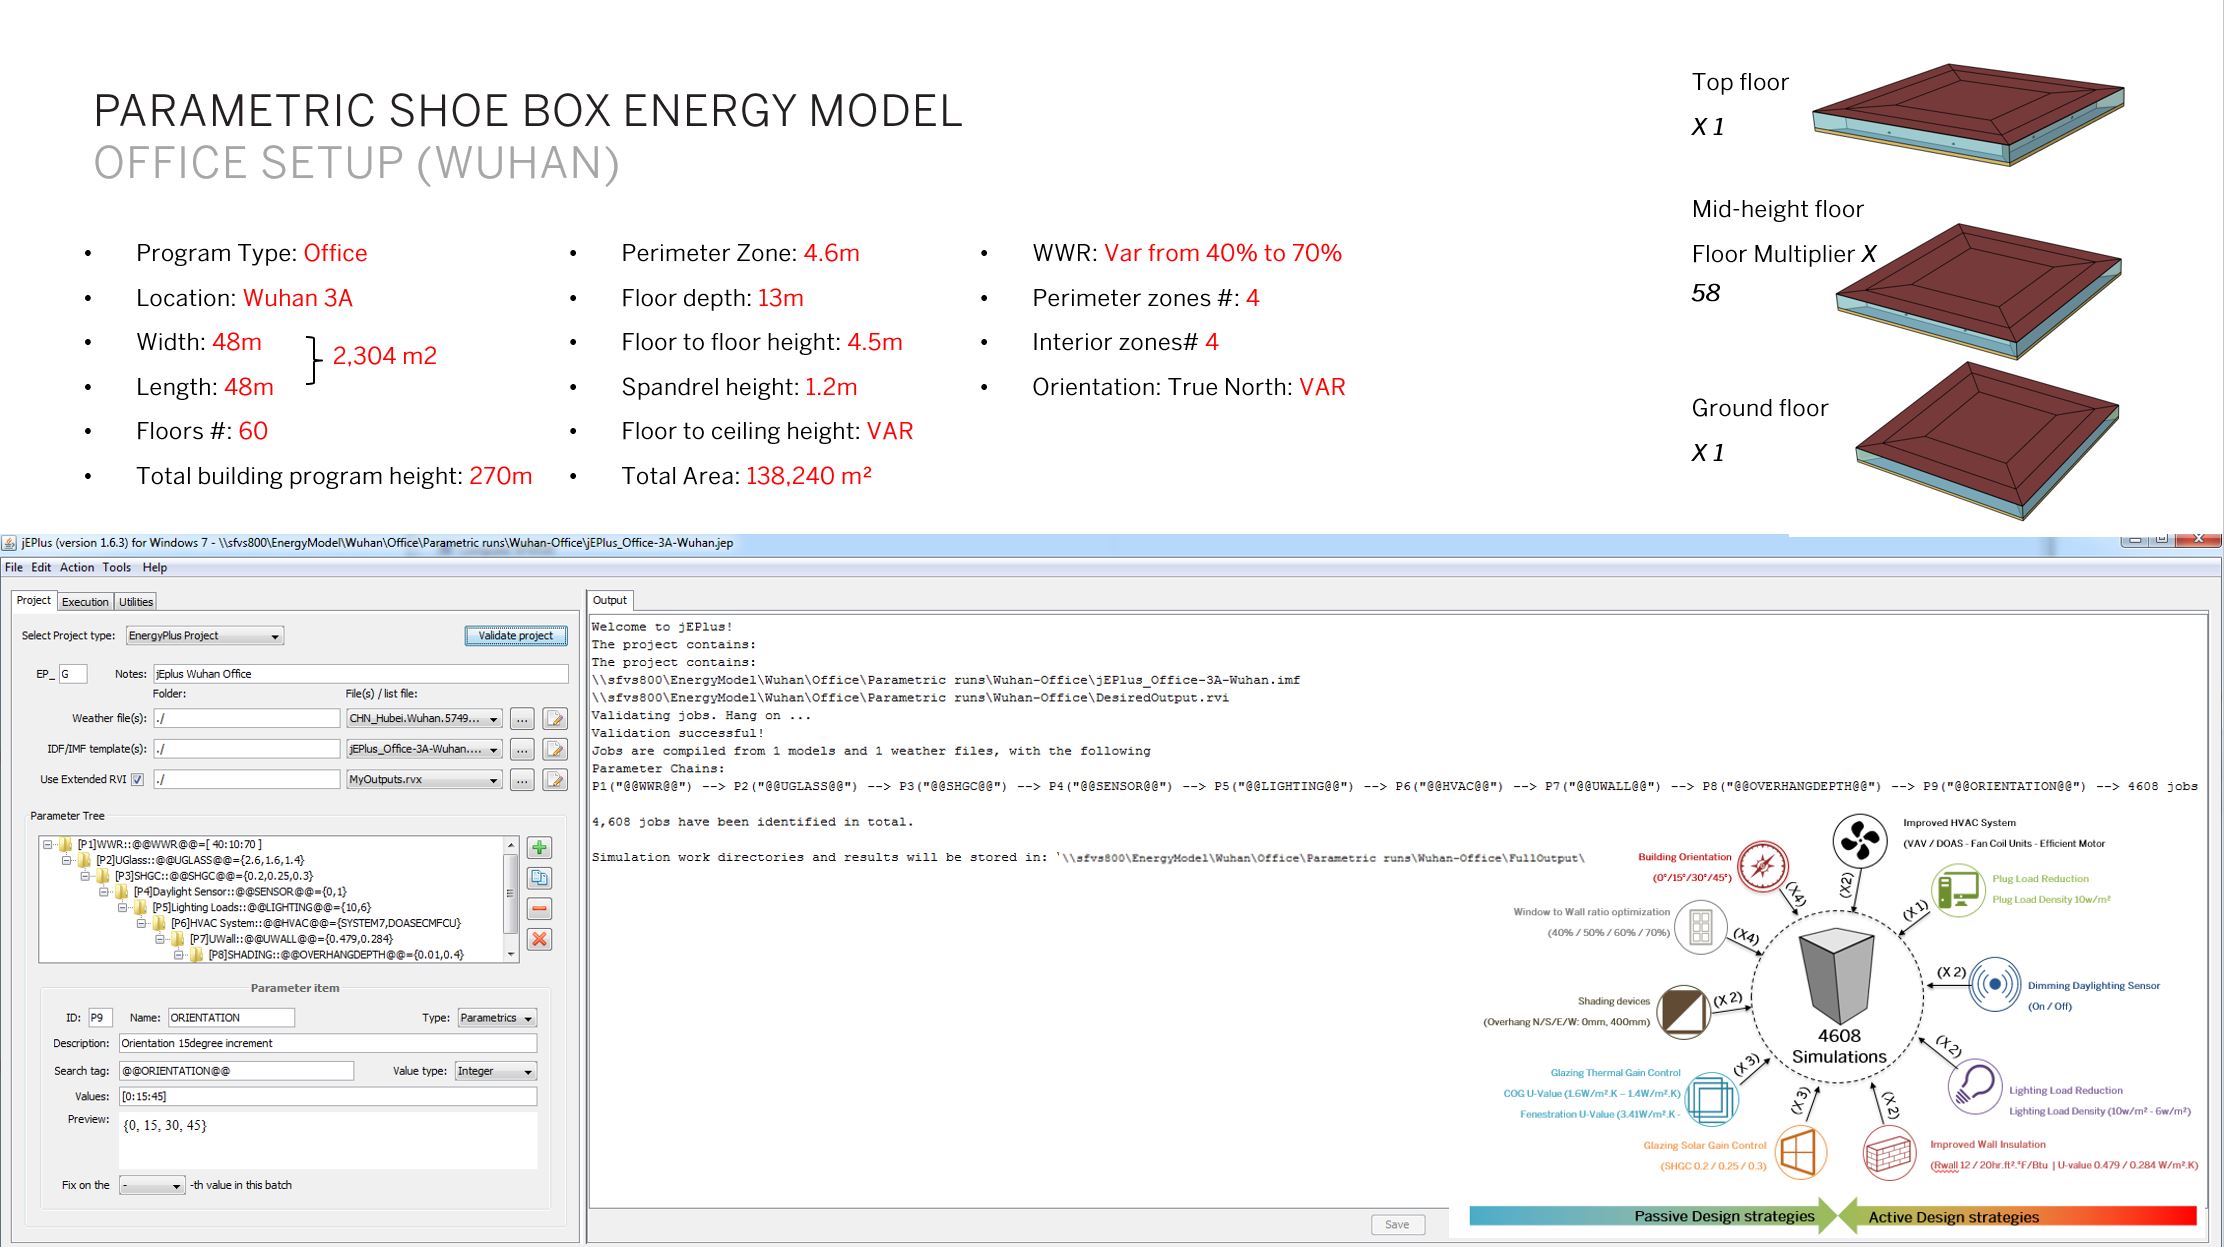
Orientation, Location, Weather file, Window-to-wall ratio, Double Glazing, SHGC, VLT, R-Value Wall, Plug Load Density, Dayligthing Sensors, Shading, Light Power Density, HVAC system
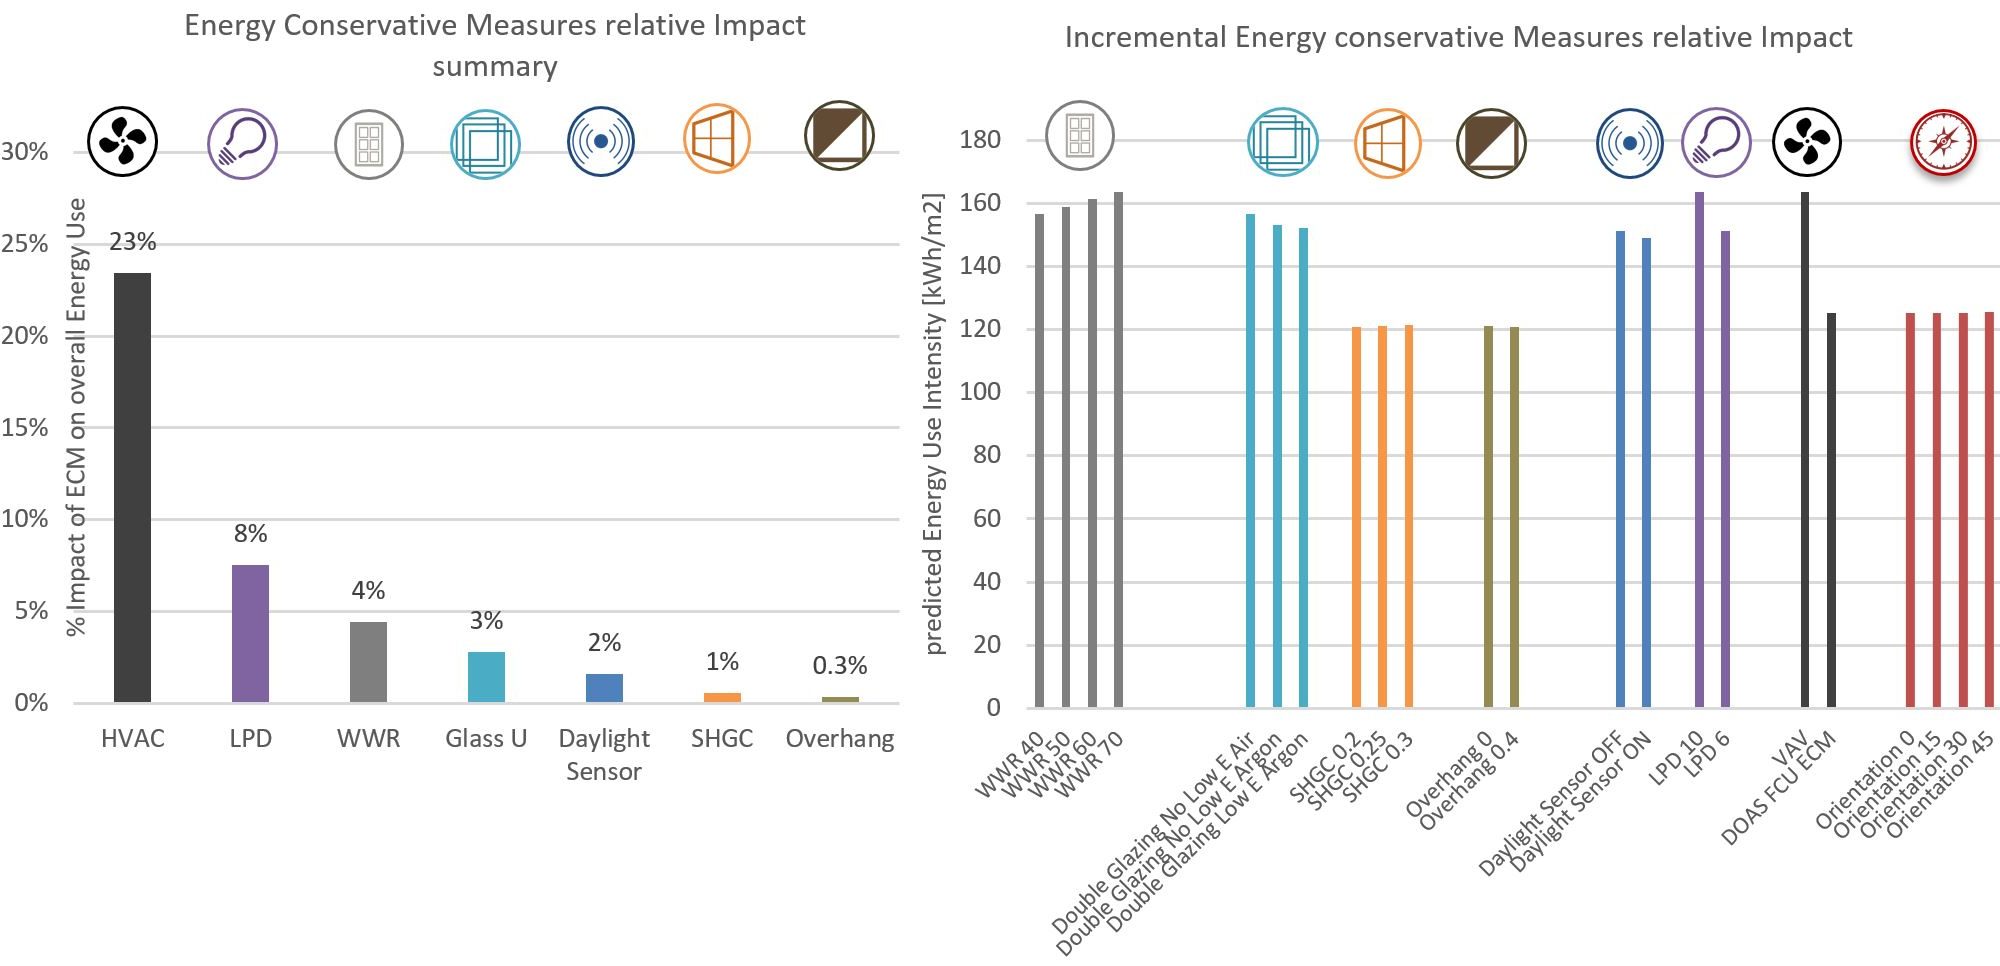
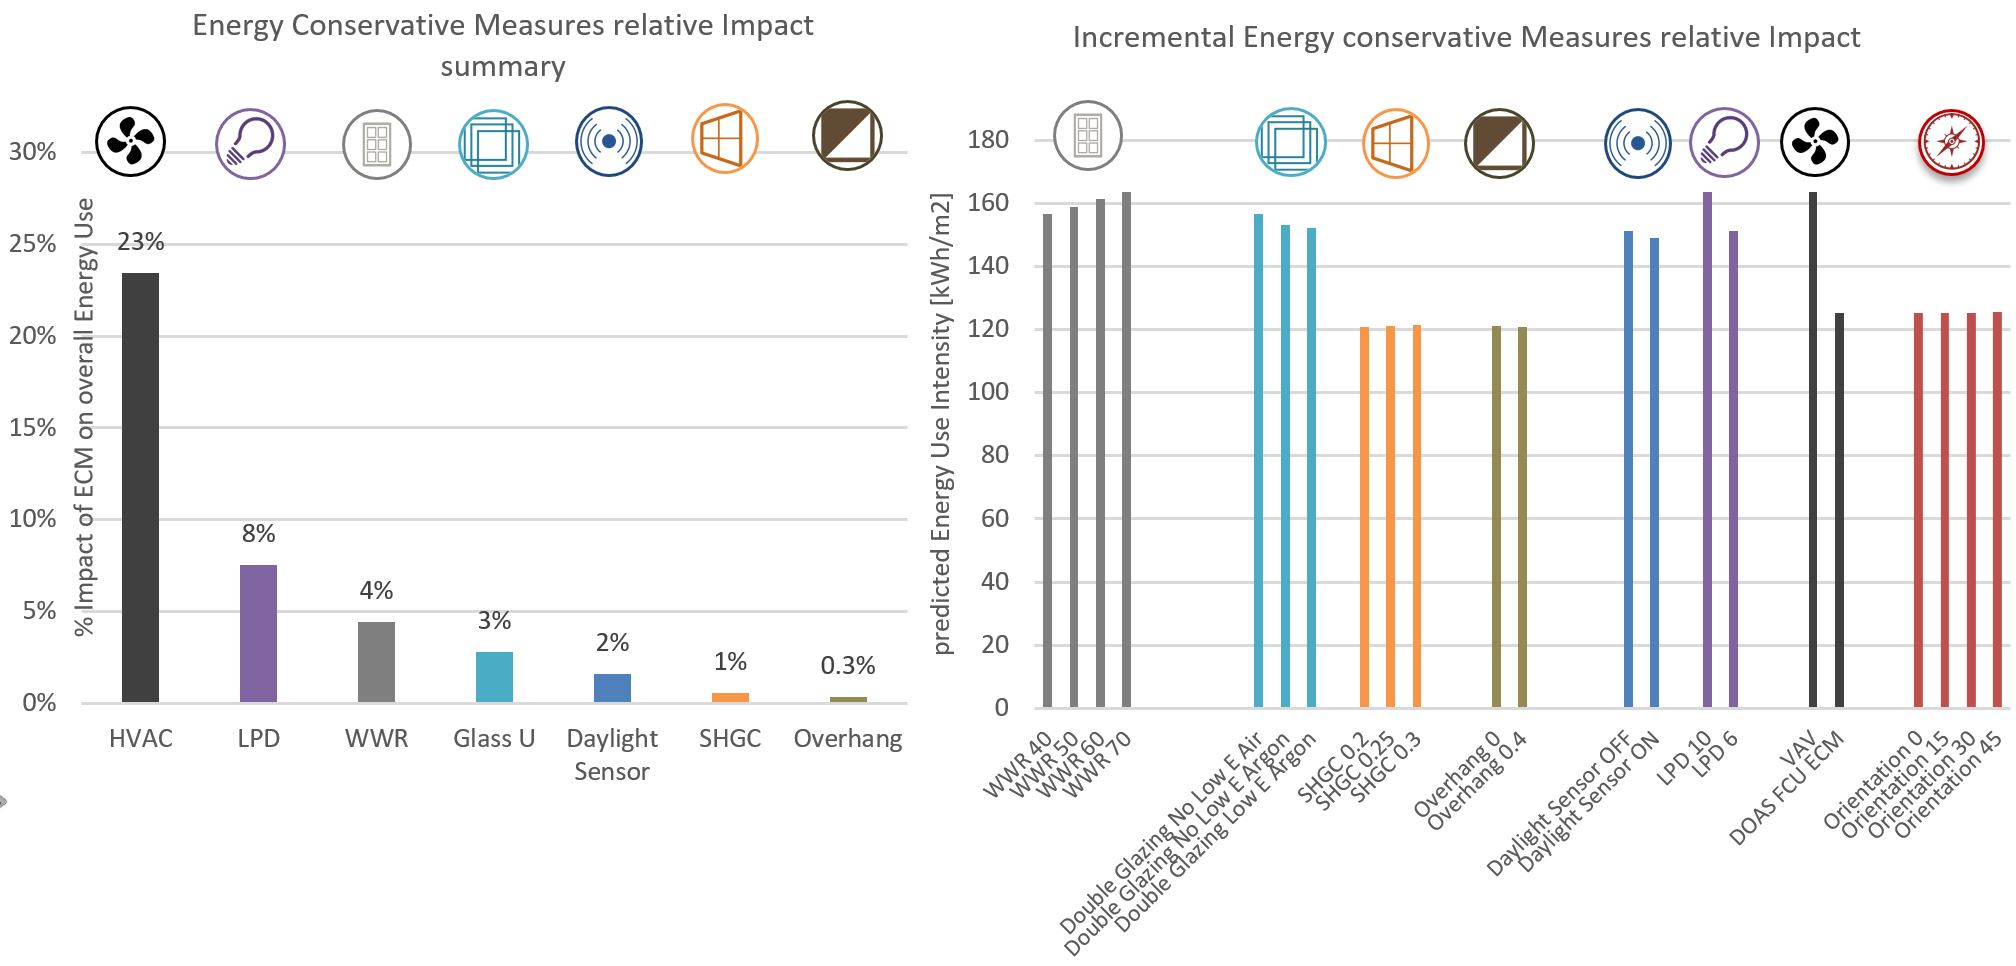
Overall predicted Energy Use Intensity (pEUI), Heating, Cooling and Lighting pEUI, solar radiations (kWh/m2), seeking for the best scheme performer
1269000
3A
- Office
SIMULATION PROCESS SECTION
What is the best massing to the whole building energy use of the project and what is the magnitude impact of various efficiency measures (Orientation, Window-to-wall ratio, Glazing Type, Solar Control, Shading Devices, Daylight Sensors, Light Power Density, Thermal Resistance of the assembly, HVAC system)?
- Architect - Internal Sustainability Personnel
- OpenStudio + Eplus
- EnergyPlus
- Conceptual Design
The simulation was integrated at a very early design phase stage to compare various massing and suggest to the client a road map to reduce energy use and solar radiations on the building scheme and to present the relative impact of different energy conservative measures at the whole building scale between passive and active measures. A parametric simulation was used at the beginning internally before summarizing the findings into a simple graphic. More than 4000 simulations were computed, used as an intermediate step. (screenshot below)

The geometry was modeled in Open Studio. The parametric energy analysis was ran with jEplus. The outputs were generated by Adobe Photoshop, Excel, Power Point.
The results were shown to the design team on a power point explaining the inputs, outputs and magnitude impact of the energy conservative measures.
This is a joint effort of 4 people: - Olivier Brouard, Sustainability Engineering Team Leader - Shaily Rungta, Building Performance Analyst - Neil Katz, Daylighting Performance Specialist - Stephen Ray, CFD Specialist - Luke Leung, MEP Engineer Team Leader - Jason Kirkpatrick, Building Performance Analyst