
What is the pathway to Net Zero Energy (NZE) for an existing building retrofit?
Jared Landsman
Integral Group
Michael Esposito
Project Information
The primary inputs in the analysis are program distribution, envelope, mechanical system, and solar PV size.
The primary metric for this analysis is annual building energy consumption.
67,000 sq ft
3A
- Office
SIMULATION PROCESS SECTION
What are the minimum envelope requirements to achieve reduced envelope loads? How much energy can be generated from solar PV on the available roof area? How will the distribution of programming throughout the building affect energy performance? What is the best mechanical system to achieve zero net energy?
- MEP Firm
- OpenStudio + Eplus
- IES-VE
- Grasshopper Honeybee
- Schematic Design
- Design Development
We worked hand in hand with the architects and mechanical designers throughout the early stages of the design to provide effective insight into making impactful design decisions. For every stage of the design process, the simulations were refined to answer each specific question that was asked of the design team.
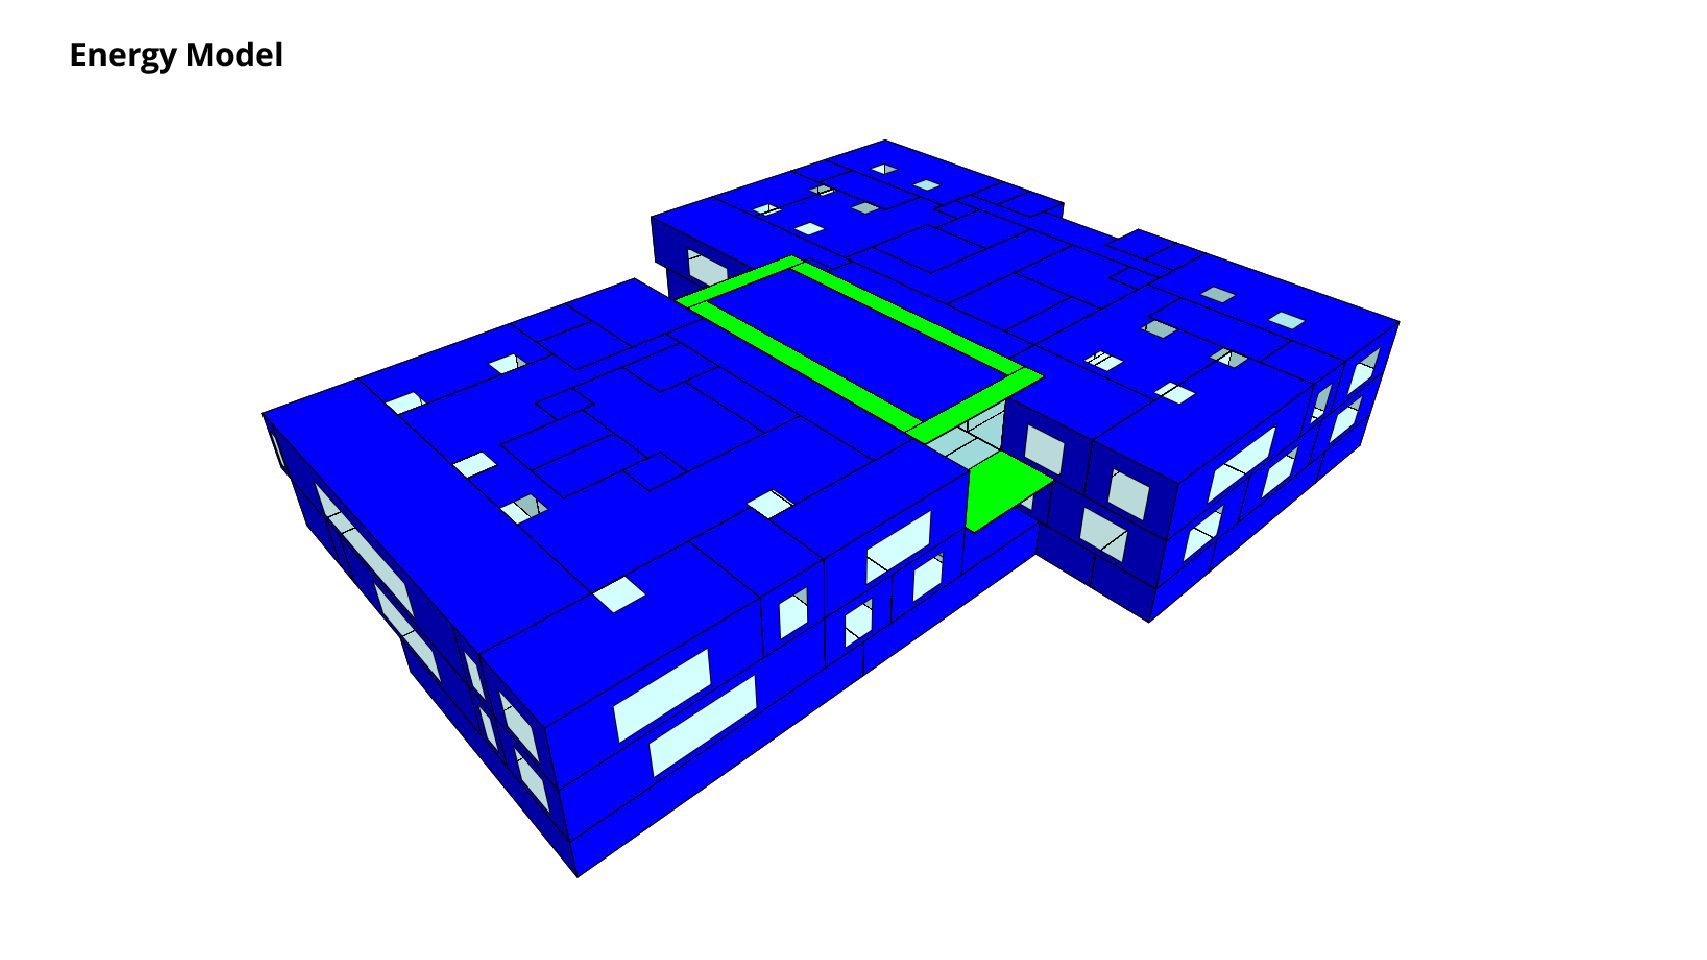
First, a simplified energy model was built in EnergyPlus, using an ASHRAE baseline HVAC system, to assess the impacts of envelope decisions on building energy consumption. Once envelope decisions were made, a more detailed energy model was created in IES-VE to look at the energy impacts of different HVAC systems. Using the selected HVAC system, the model was then used to assess the energy implications of how the architectural program was distributed across the building. One option had the building with mixed program usage on each floor, and the other option had different program uses separated. A separate model was developed in Grasshopper to assess the energy generation potential from Solar PV.
All outputs were extracted from the energy simulation softwares and post-processed in either Microsoft Excel or Adobe Photoshop. Finally, they were presented to the client and design team, via PowerPoint, in several design charrettes. The visualizations used for the case study conveyed the results of our study in a concise manner than the clients were easily able to grasp.
The drop down menus should allow you to write in your own options. For example, I wanted to list "hand drawings" as a tool for creating graphics, but this was not an option I could select.