What is the impact of the deciduous tree species choice on daylight, visual comfort, dynamic shading, and energy utilization? (Competition Winner)
Project Location:
Simulation Scale:
Application:
Audience:
What is this graphic showing? Describe the different parts of the graphic and how it communicates the data.
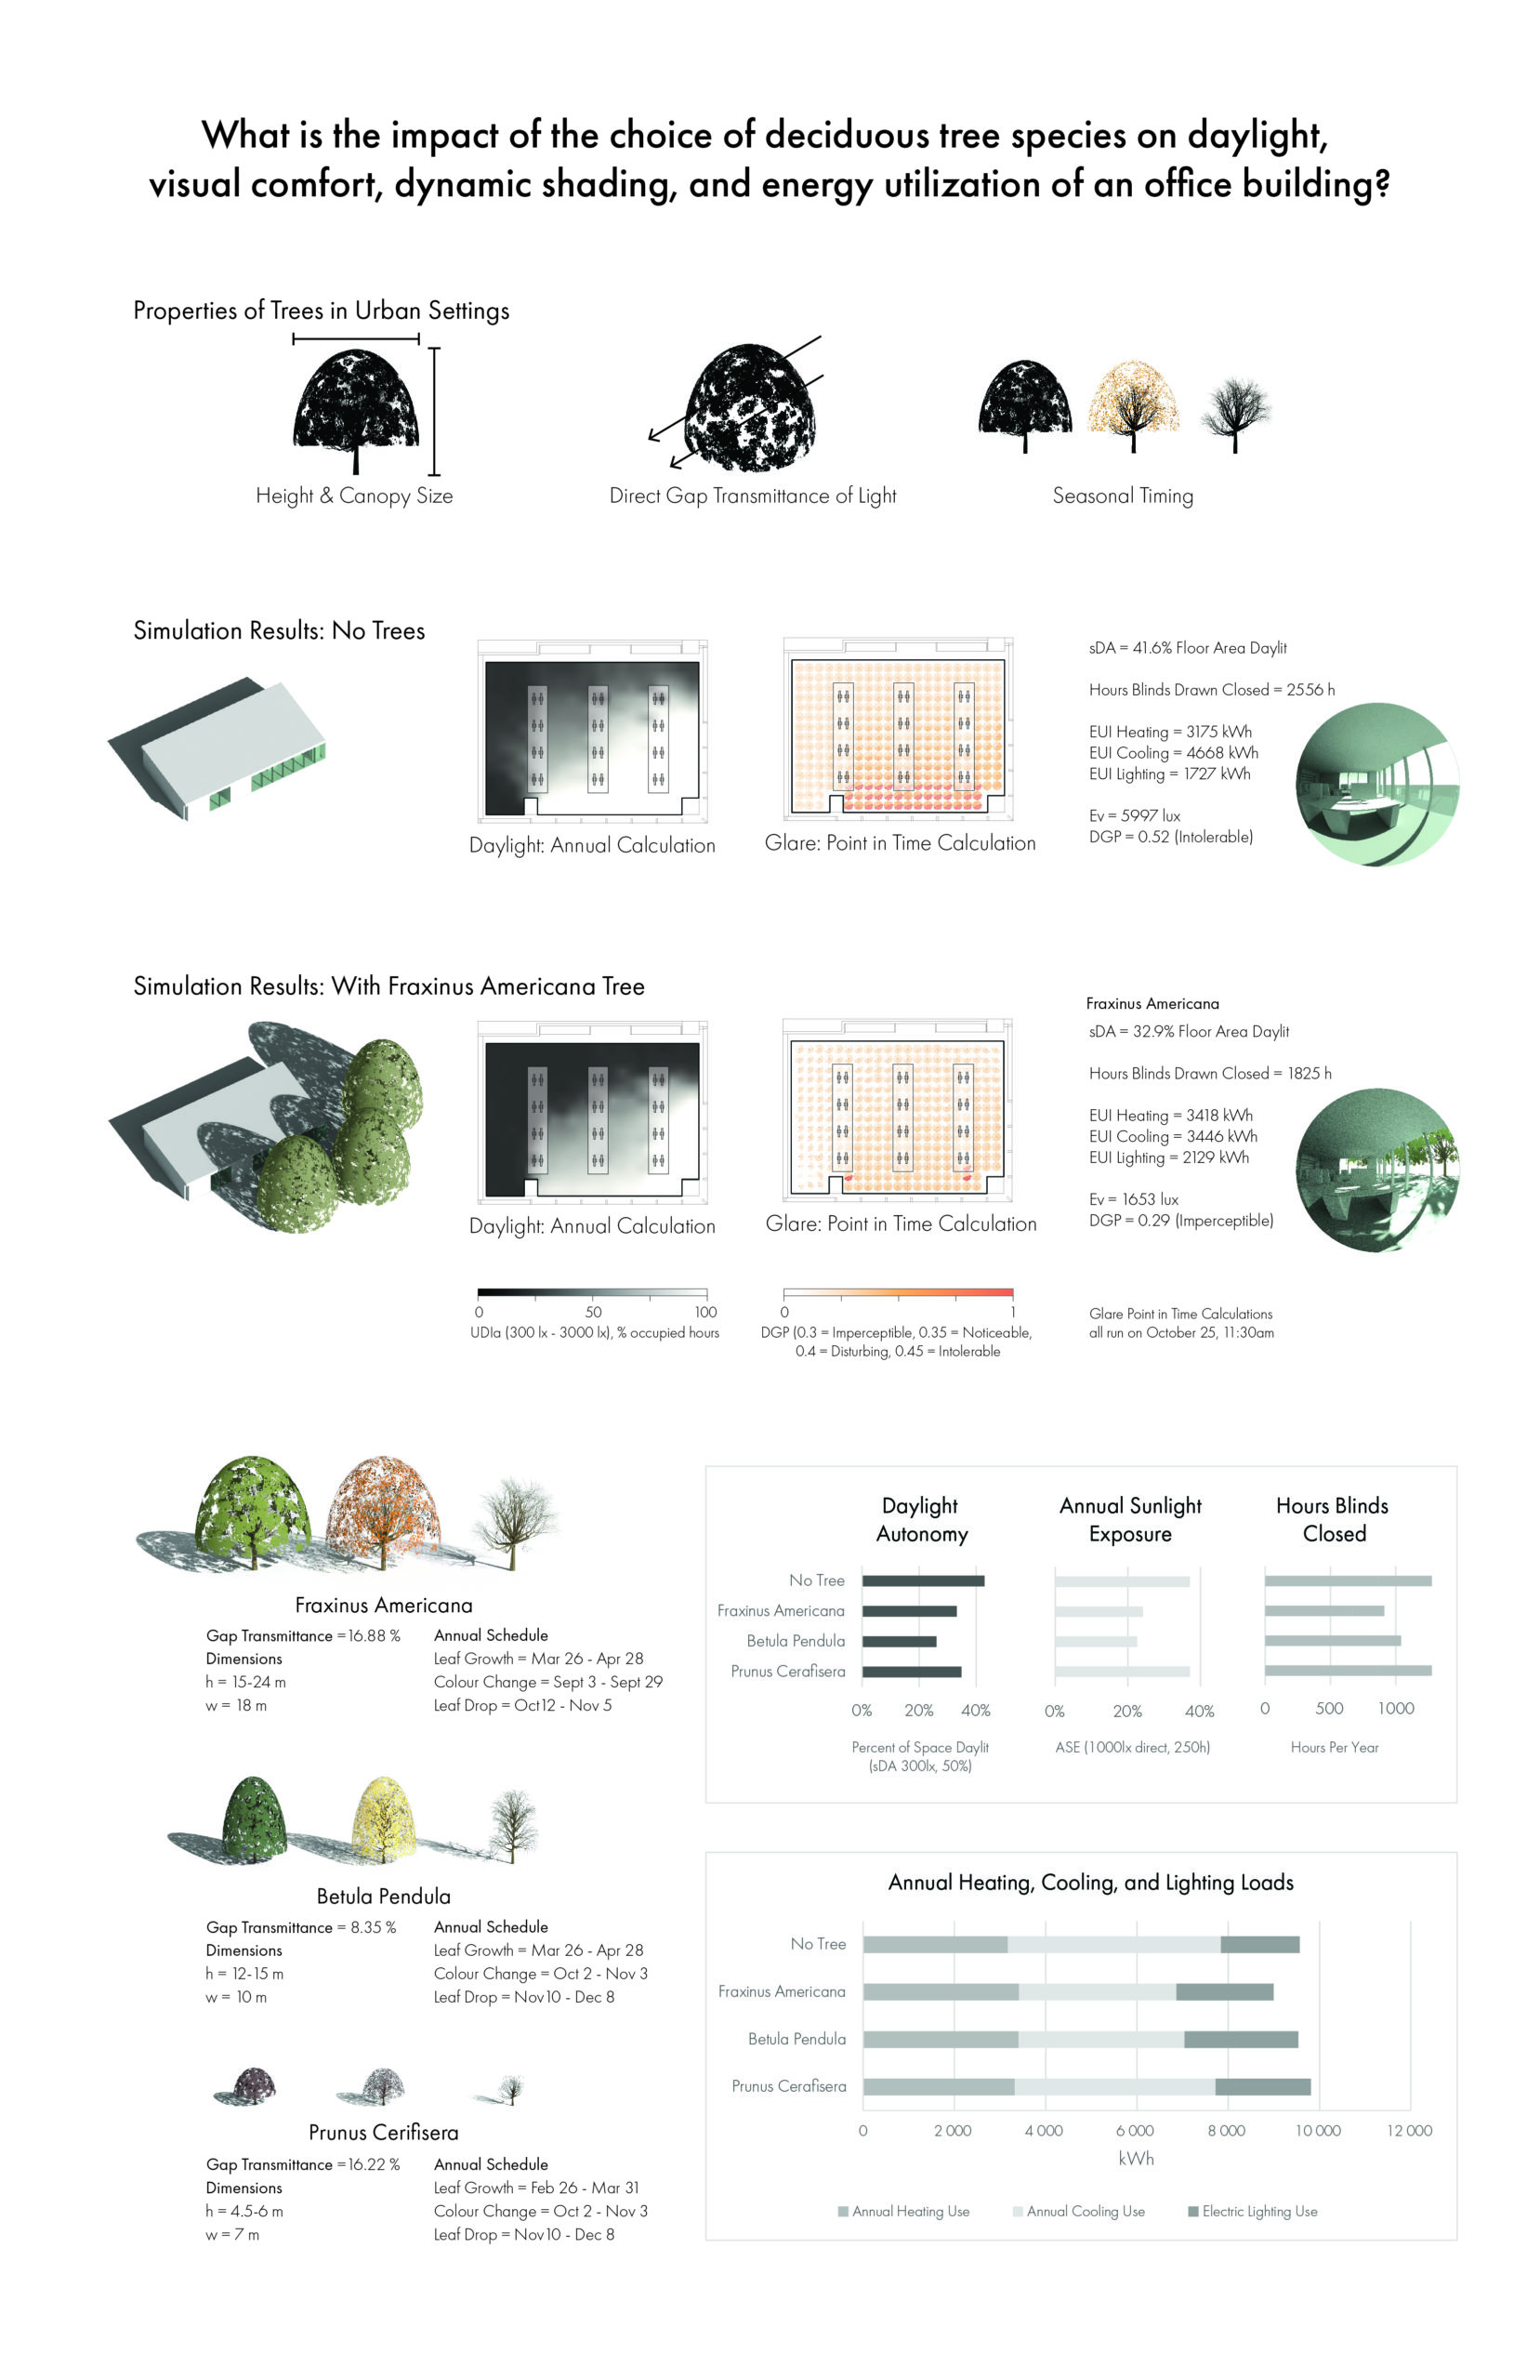
This graphic presents the impact that the selection of deciduous trees has on building performance, specifically on daylight, glare, energy and view. Simulations were run using the ClimateStudio GUI for Radiance augmented by custom Python scripts to control the annual schedule of leaf colour, leaf drop, and growth and to connect the shading effect of those to a thermal simulation using EnergyPlus. The first part of the graphic shows different properties of trees that were studied through research and direct physical measurements which are taken into account by the daylight, dynamic blinds, visual comfort and energy simulations. The second part simulates a building with no tree which serves as a baseline to compare against detailed simulations of deciduous trees. The bottom half of the graphic investigates the environmental performance of three different species of deciduous trees surrounding a ground-floor office space with south and west exposures located in Vancouver, BC, Canada. This study portrays a selection of analyses from a larger research project on modelling the influence of trees on daylight, glare and energy with as much realism as possible. There are significant differences in lighting, heating, and cooling loads when using models from IES LM-83's evergreen, opaque tree recommendation or no trees at all when compared to our tree detailed tree models with gaps in canopy foliage, seasonally varying leaf drop, and regrowth. We want to portray what a design comparison might look like when using realistic, seasonally varying tree models and how they could enable designers to select tree species specifically to influence positive lighting and energetic design outcomes.
What type of graphic is this?
- Case Study / Multiple
- Table / Chart
- Diagram
Design Variables
- Other
- Window shading/sun control
Is this part of the ASHRAE-209 cycle?
- Cycle 2 Conceptual Design
- Cycle 3 Load Reduction
What tools were used for the simulation analysis?
- Other
What tools did you use to create the graphic?
- Adobe Illustrator
- Adobe Photoshop
- Excel
- Grasshopper/Rhino
- Python
What was successful and/or unique about the graphic in how it communicates information?
Displaying the interaction between dynamic landscape elements and building performance is not typically considered in sustainable architectural design and building performance simulations. This graphic allows designers to assess the holistic performance impacts on light, energy, and aesthetics as we present how the choice of a tree species can have complex simulation needs and variable outcomes.
Is there anything else you would like to mention?
This project was worked on in collaboration with Alstan Jakubiec. The tools used in the simulation analysis are ClimateStudio, Radiance, and Python.
Included in the competition:
Daylighting and Glare with Side Lighting
July 15, 2021-September 20, 2021