What is the impact of various window-shading assemblies on Indoor comfort related to daylighting and glare?
Project Location:
Simulation Scale:
Application:
Audience:
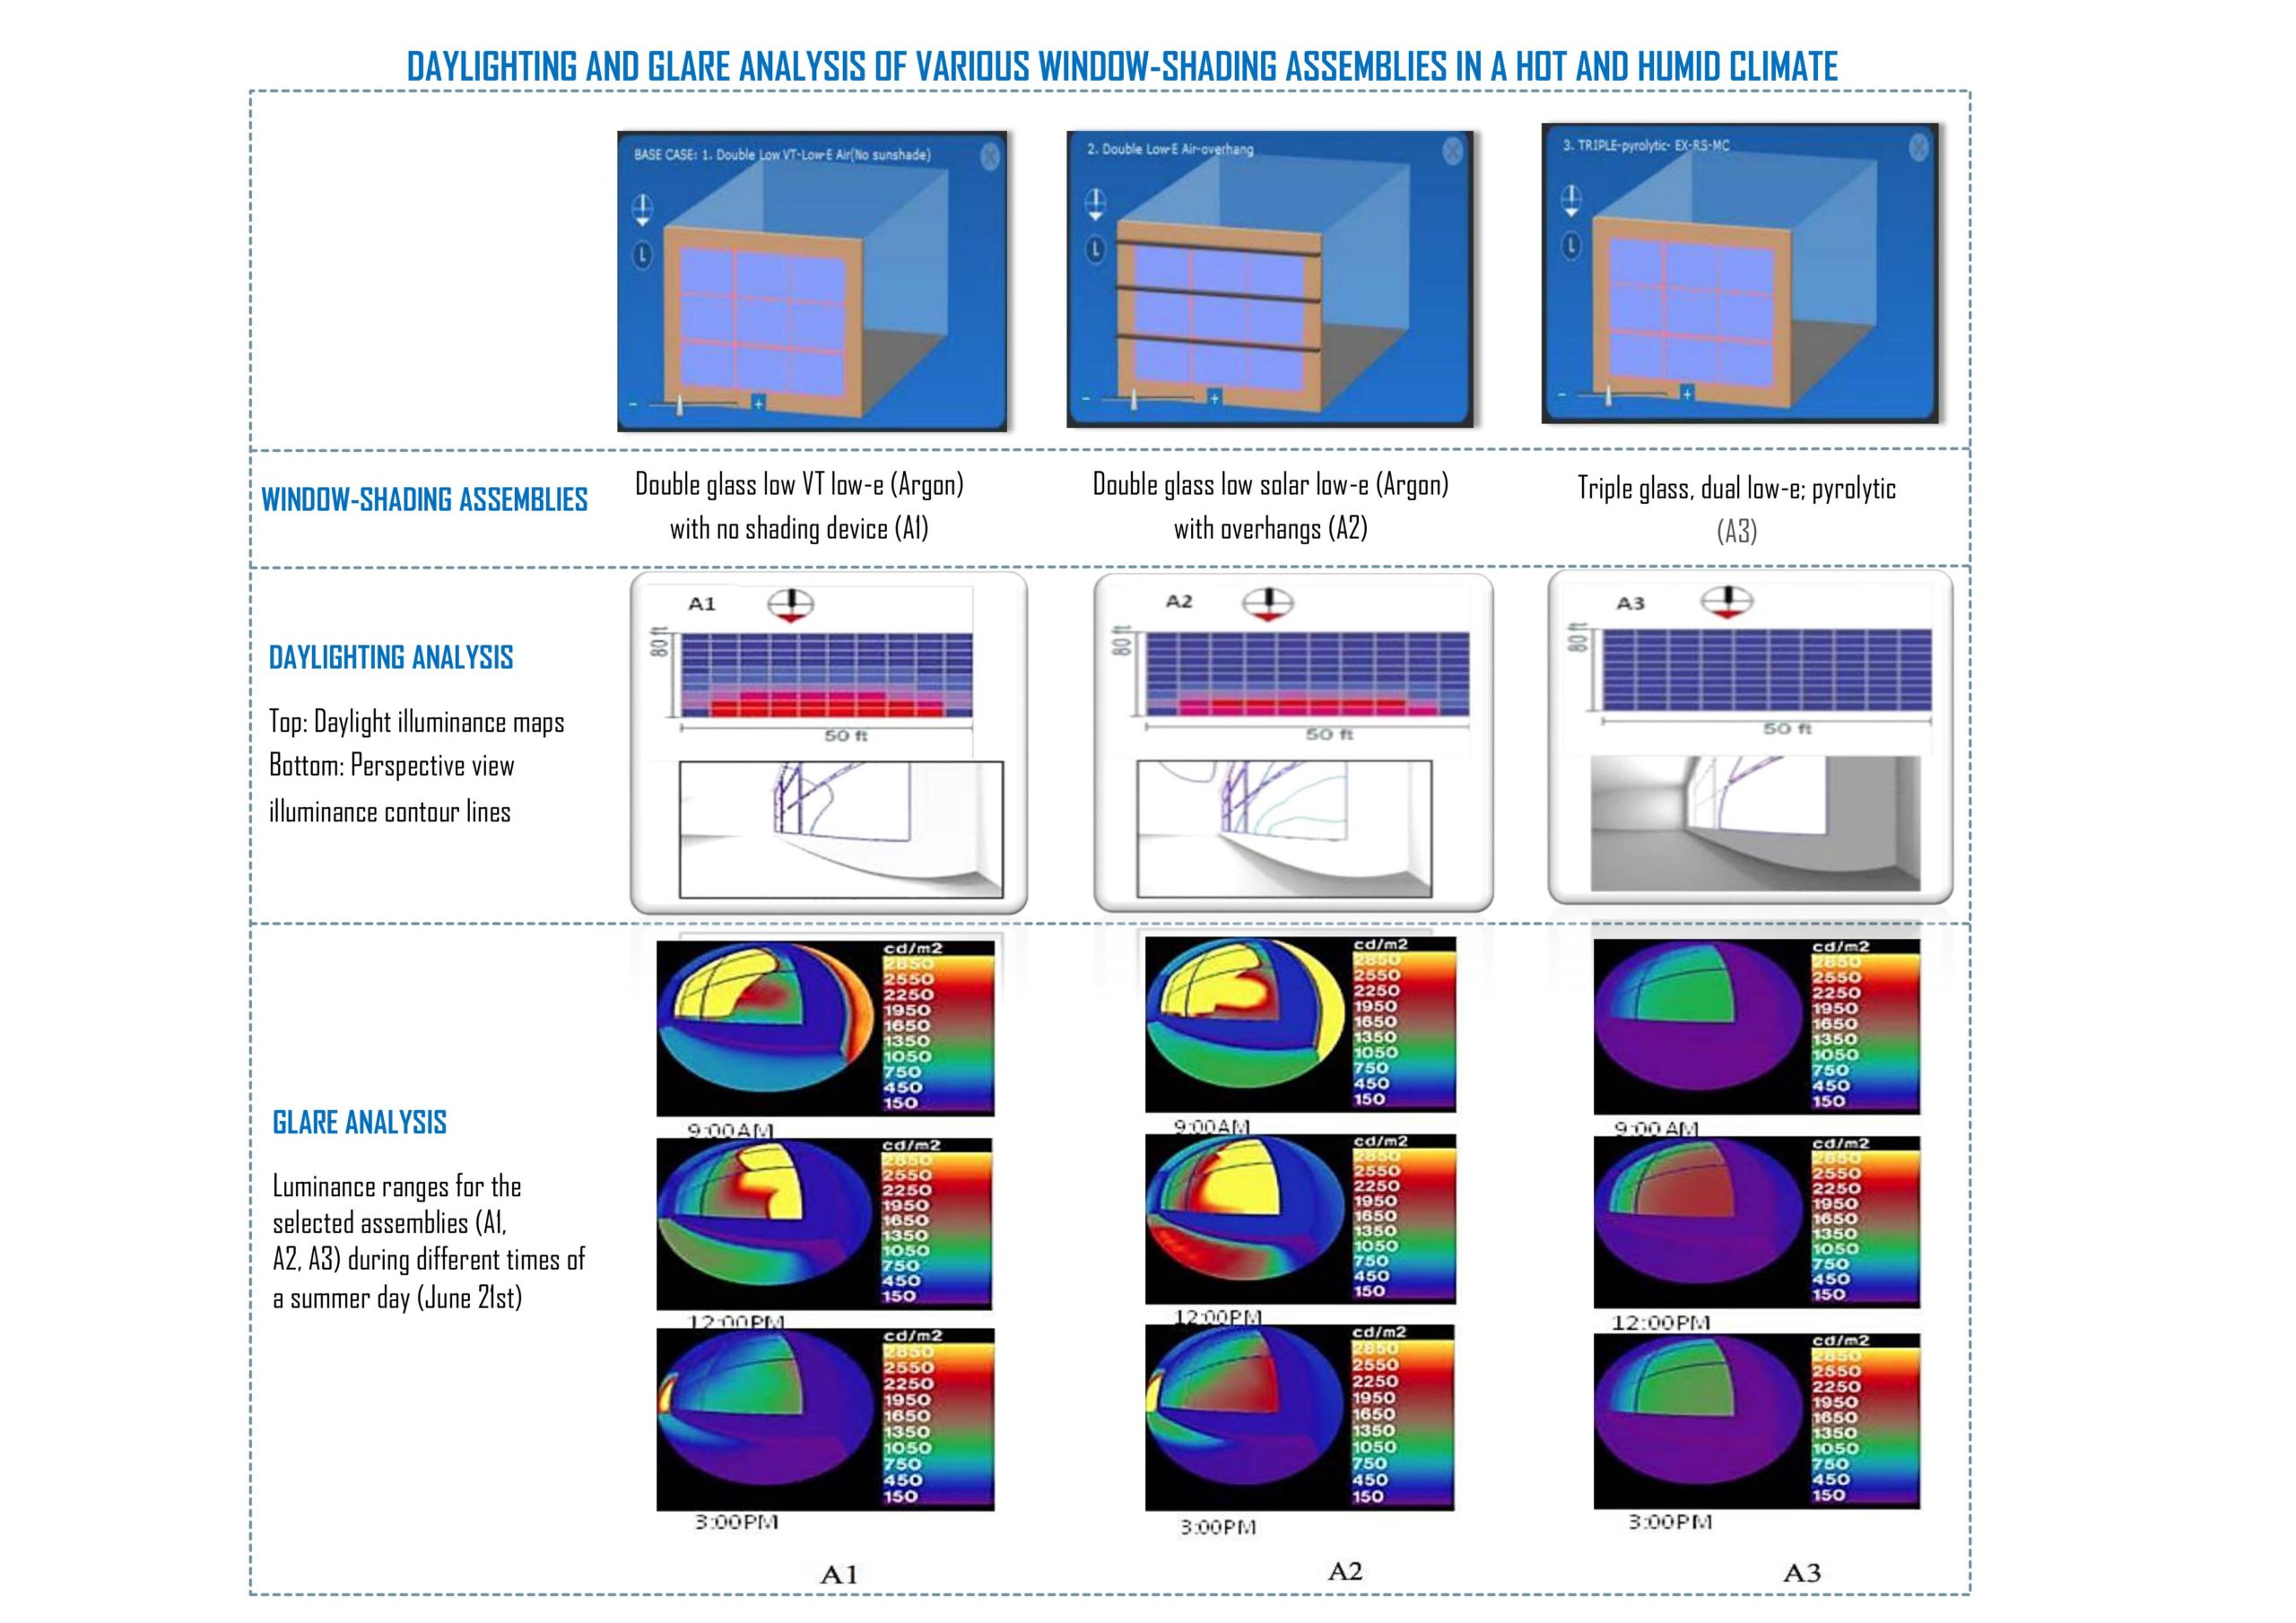
What is this graphic showing? Describe the different parts of the graphic and how it communicates the data.
Daylighting analysis was performed for the selected window-shading assemblies for an office building and daylight illuminance maps were generated for a summer day (June 21st at 11:00AM). These maps displayed work surface illuminances, calculated at 2'-6" (0.762 m) above the floor (default value), for the entire space in the form of a 10 x 10 grid (the grid is scaled to fit the space in the software). The maps showed high illuminance values for assemblies A1 and A2 near the façade area inside the office, whereas low, but uniform illuminance level was observed when using assembly A3 because the roller shades were on at that time of the day. The selected window-shading assemblies were further compared to study the glare during the clear summer day from South side. The occupant’s position (X=9.3,Y=15.6) and angle of view (X=6, Y=-9.6) were defined and point-in-time simulations were run for June 21st at 9:00AM, 12:00PM and 3:00PM
What type of graphic is this?
- Case Study / Multiple
- Diagram
Design Variables
- Glass U-value / SHGC
- Glazing Fraction/Window to Wall ratio
- Window shading/sun control
Is this part of the ASHRAE-209 cycle?
- Cycle 1 Simple Box Model
- Cycle 2 Conceptual Design
What tools were used for the simulation analysis?
- EnergyPlus
- Other
What tools did you use to create the graphic?
- Adobe Photoshop
- Direct Software Output
- PowerPoint
What was successful and/or unique about the graphic in how it communicates information?
Efficiency of the selected glazing-shading systems as a whole assembly was studied under site specific conditions. It was observed that use of assemblies A1 and A2 caused really high values of glare during the morning and afternoon which is uncomfortable for the occupants whereas use of assembly A3 caused minimum glare values (≈55% less than A1 and 61% less than A2 at noon) throughout the day.
Is there anything else you would like to mention?
This graphic is a part of a larger study. The main objective of this study was to investigate the impacts of these thermal and optical properties on the overall performance (energy consumption, and thermal and visual comfort) of south facing mid-rise office building in a hot and humid climate. COMFEN 5 and EnergyPlus was used for the analysis. Images for glare analysis were rendered using Radiance
Included in the competition:
Daylighting and Glare with Side Lighting
July 15, 2021-September 20, 2021