What is the impact of Daylight on Energy Use Intensity?
Project Location:
Simulation Scale:
Application:
Audience:
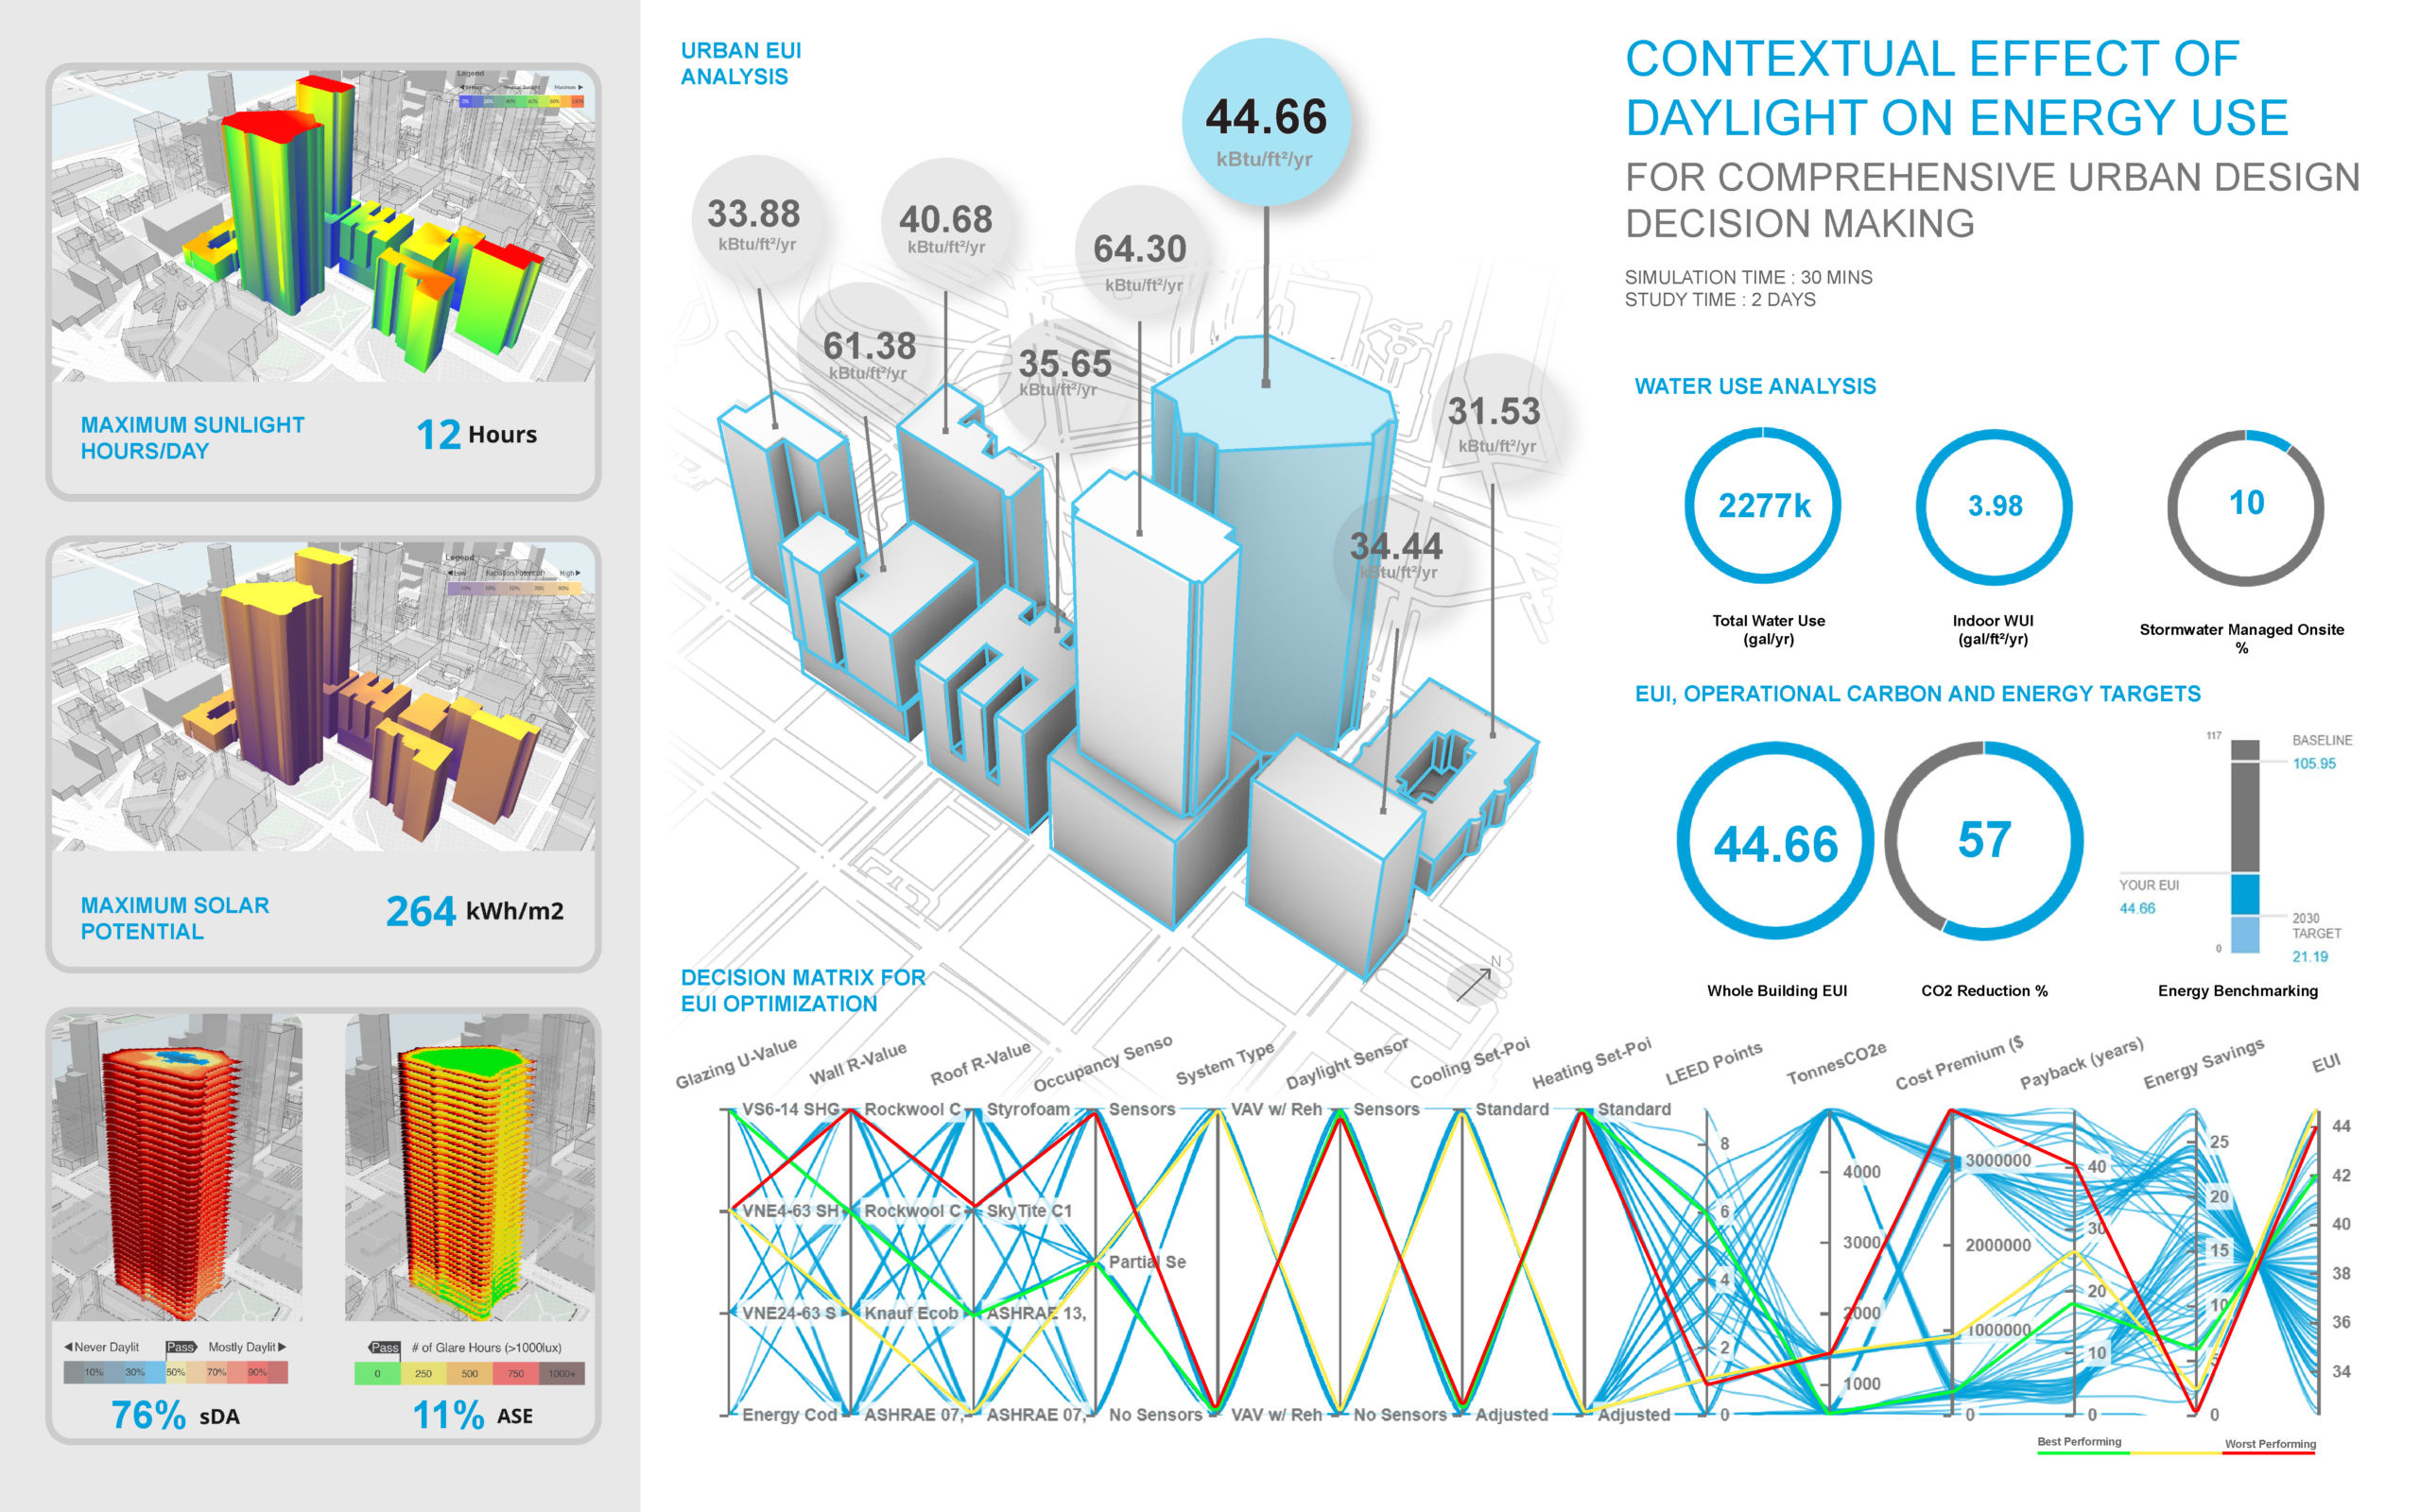
What is this graphic showing? Describe the different parts of the graphic and how it communicates the data.
This graphic presents the analysis results used for early decision making with respect to placement of solar PV, optimizing energy use results by selective alteration of building use parameters, whether buildings can be considered for LEED certification, etc for a master planning project. The study uses rapid analyses performed using web based applications to study the contextual impact of buildings with respect to Solar Irradiance, Daylighting, EUI and Water metrics. At a higher level- the understanding of Solar irradiance and Sun hours analysis suggests the roofs and southern facades of the masses could be designed to be used to harness solar energy. The lower level floorplates that have a substantially lower sDA considering the impact of shade from the surrounding buildings and factors such as artificial lighting/ rearrangement of spaces need to be factored in while planning space layouts for the office building. The building's total water usage can be a sizable hit on operation costs if the water fixtures meet the efficiency targets. Currently, for the building under consideration, the Water Use Intensity is per standards but incase it is higher in other situations, strategies to reduce potable water which entail the selection of efficient plumbing fittings, fixtures, and equipment would need to be considered. Moving forward, the daylighting metrics and optimized bundles for individual options use machine learning to run thousands of simulations to provide the most optimized ways to get to a high performing building with the least cost premium and lowest EUI. For the building under consideration, the iterations with the best and worst combinations of building parameters are highlighted. These can be further modified to reach the optimal energy and cost values for individual buildings in the project. In this case - the best iteration is chosen from the parallel plot chart which is then taken ahead for detailed energy analyses. The graphs include Solar Irradiance, Sun Hours analysis, Daylighting (sDA + ASE), Operational Carbon, EUI, AIA 2030 target setting for benchmarking and a Parallel Coordinate graph for optimized energy and cost results.
What type of graphic is this?
- Diagram
Design Variables
- Building Massing
- Building Materials
- Glass U-value / SHGC
- HVAC performance/system selection
- Insulation R-value
Is this part of the ASHRAE-209 cycle?
- Cycle 3 Load Reduction
What tools were used for the simulation analysis?
- Cove.tool
What tools did you use to create the graphic?
- Adobe Illustrator
- Grasshopper/Rhino
What was successful and/or unique about the graphic in how it communicates information?
It provides a wholistic understanding of how different buildings interact with each other in terms of various performance metrics. Traditionally conducting such analysis has been a rigorous task which takes a lot of time, effort and specialized skillset. Using easy web based platforms- graphics were created using an automated process taking less than 2 days from inception to conclusion.
Is there anything else you would like to mention?
Included in the competition:
Daylighting and Glare with Side Lighting
July 15, 2021-September 20, 2021