What is the impact of different energy conservation measures (ECM’s) on a proposed office building’s annual energy bills??
Project Location:
Simulation Scale:
Application:
Audience:
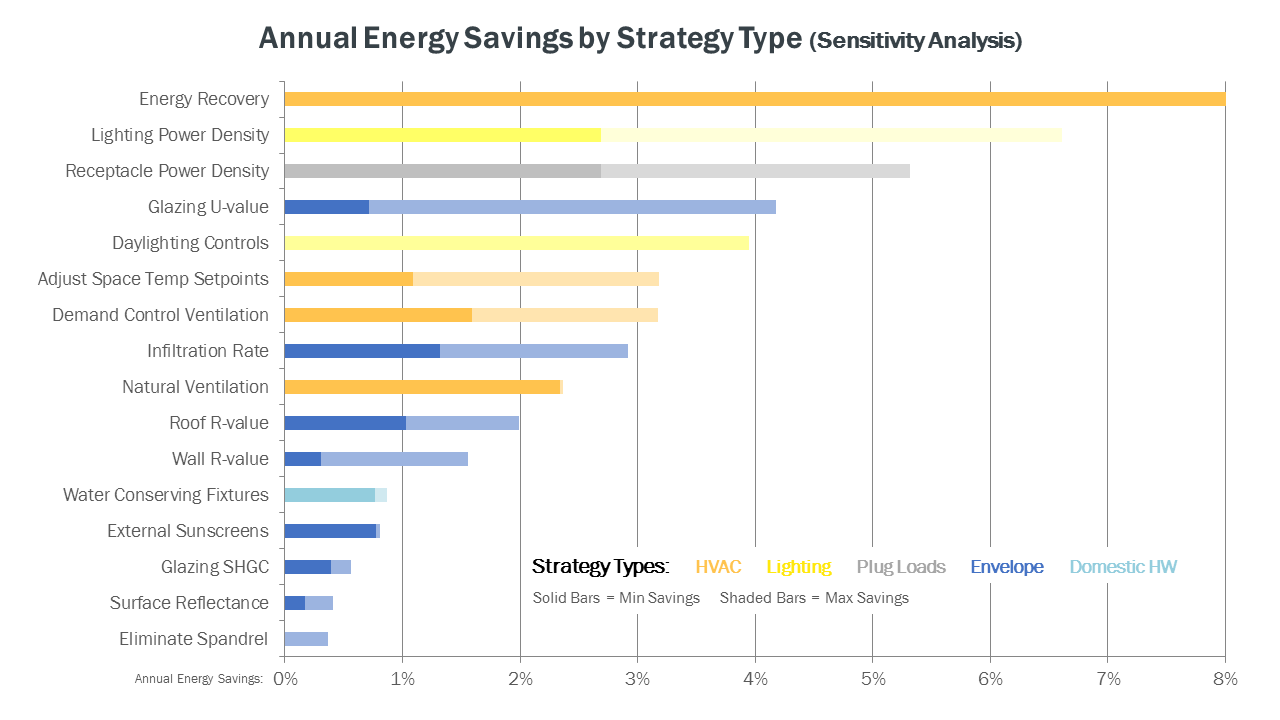
What is this graphic showing? Describe the different parts of the graphic and how it communicates the data.
This graphic communicates the results of a sensitivity analysis evaluating the impact of different energy conservation measures (ECM’s) on the annual energy costs of a proposed office building design. ECM's are color-coded by category and plotted along the vertical axis of a stacked bar graph, with their modeled annual energy savings plotted along the horizontal axis (in $ / yr). ECM’s are organized in descending order with those that resulted in the largest annual energy savings located at the top of the graph. A high and low range for the potential impact of each ECM is plotted on the graph through the use of solid and shaded bars.
What type of graphic is this?
- Table / Chart
Design Variables
- Glass U-value / SHGC
- HVAC performance/system selection
- Insulation R-value
- Other
- Passive strategies
- Window shading/sun control
Is this part of the ASHRAE-209 cycle?
- Cycle 1 Simple Box Model
What tools were used for the simulation analysis?
- Sefaira
What tools did you use to create the graphic?
- Excel
- PowerPoint
What was successful and/or unique about the graphic in how it communicates information?
The combination of color-coding, rank order, and solid / shaded bars helps the graphic quickly communicate a large volume of information that would be much more difficult to analyze in the default format generated by most energy modeling software. Color-coding the ECM's by category (HVAC, lighting, etc) also helps viewers quickly discern which categories led to the most energy savings.
Is there anything else you would like to mention?
One caveat we include with this type of graphic is that evaluating individual ECM’s in isolation can result in an incomplete understanding of their aggregate impact. By “bundling” different ECM’s together in response to this analysis, design teams can evaluate potential trade-offs and identify the point of diminishing returns between strategies.
Included in the competition:
Simple Box Modeling - see sample question below. You are encouraged to come up with your own
November 16, 2021-January 29, 2022