What is the impact of each energy efficiency strategy on building performance?
Project Location:
Simulation Scale:
Application:
Audience:
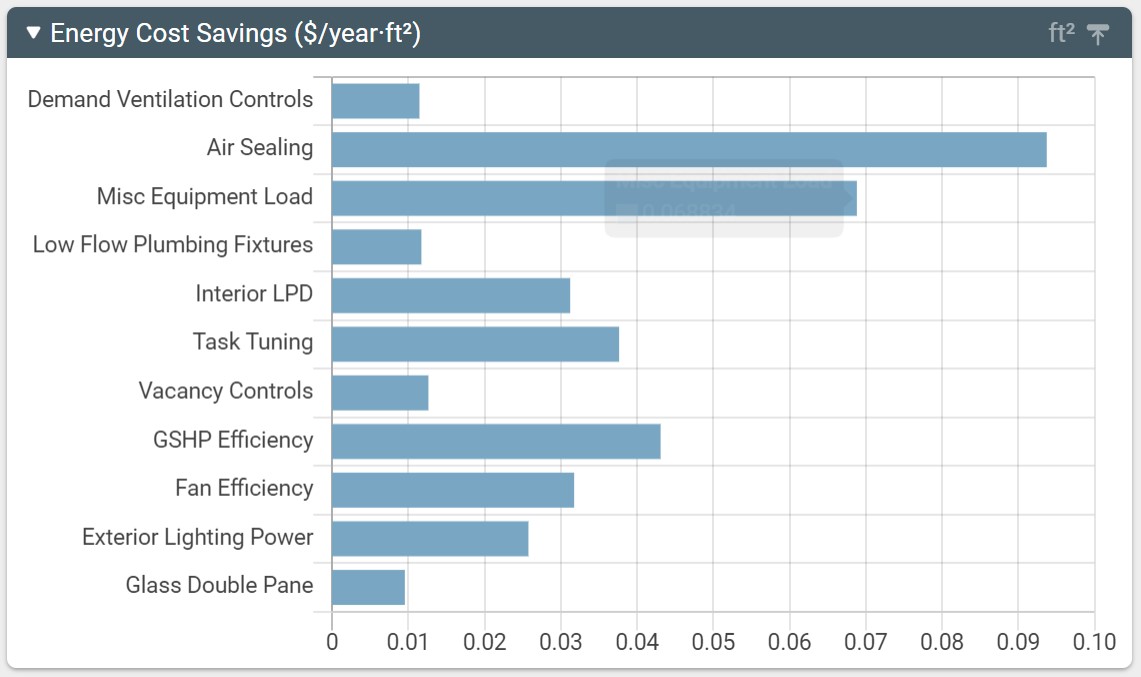
What is this graphic showing? Describe the different parts of the graphic and how it communicates the data.
What type of graphic is this?
- Table / Chart
Design Variables
- Building Massing
- Building Materials
- Glass U-value / SHGC
- Glazing Fraction/Window to Wall ratio
- HVAC performance/system selection
- Insulation R-value
- Other
- Window shading/sun control
Is this part of the ASHRAE-209 cycle?
- Cycle 1 Simple Box Model
- Cycle 2 Conceptual Design
- Cycle 3 Load Reduction
- Cycle 4 HVAC System Selection
- Cycle 5 Design Refinement
- Cycle 6 Design Integration + Optimization
- Cycle 7 Energy Simulation-Aided Value Engineering
What tools were used for the simulation analysis?
- Other
What tools did you use to create the graphic?
- Direct Software Output
What was successful and/or unique about the graphic in how it communicates information?
This graphics are unique because they are native output of our new Sketchbox concept design tool. The results are presented measure-by-measure and quickly show designers which strategies have the greatest impact on energy performance. No post processing is required and the results can dynamically change to show a variety of output metrics like energy cost, EUI, CO2, etc.
Is there anything else you would like to mention?
Slipstream is a non-profit organization with a mission to accelerate climate solutions for everyone. To help with this, we developed this "shoebox" modeling tool called Sketchbox. Sketchbox is a web-based tool that assembles and runs DOE2 models in the cloud from any web-connected device. It is optimized for concept design and includes reliable code baseline values and defaults.
Supplementary Graphics
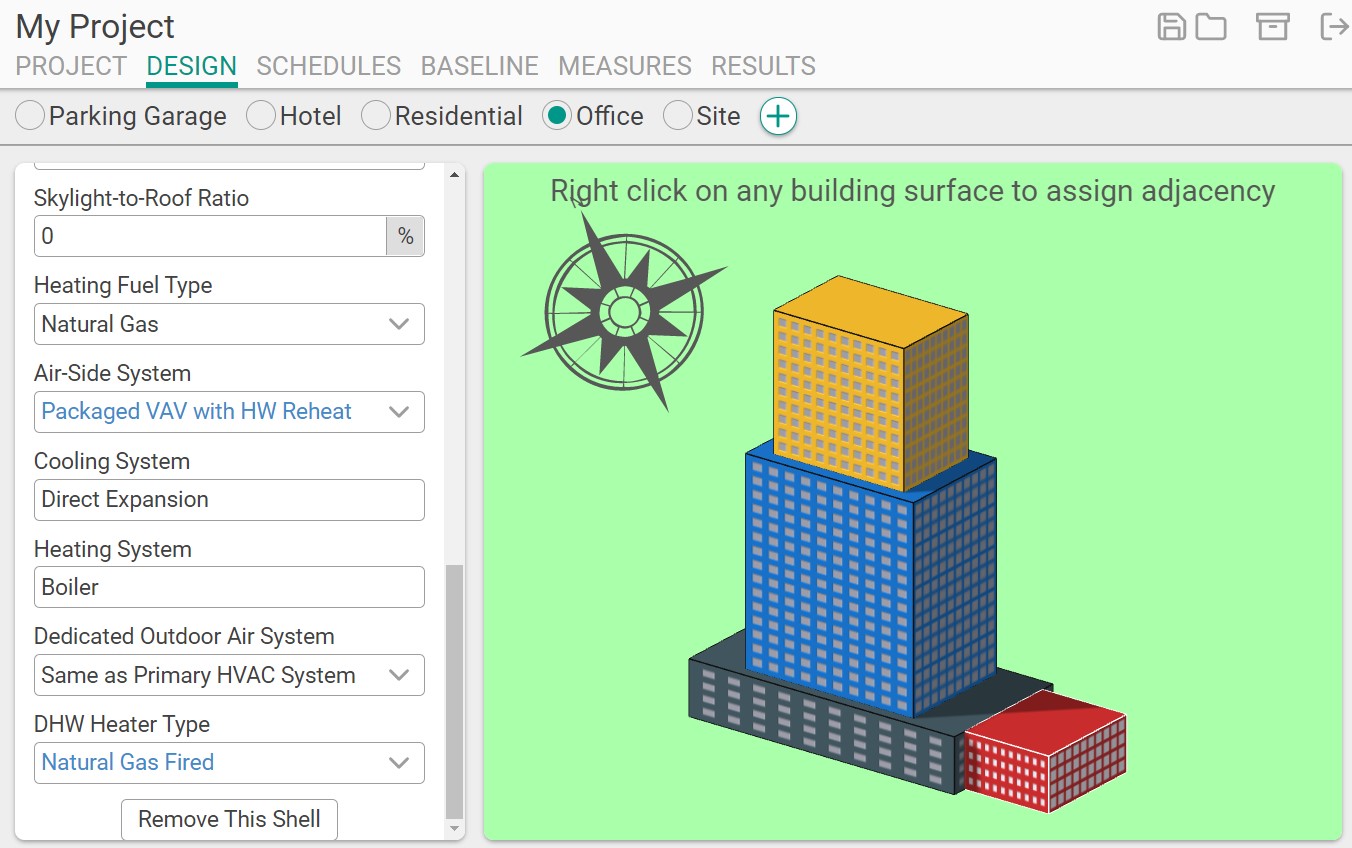
Sketchbox de-emphasizes geometry details in favor of simplicity and speed. It allows users to combine boxes with different programming, orientations, and HVAC systems to assemble more complex buildings.

Sketchbox includes reliable default measures, baseline values, and proposed values to streamline concept design.

This bar chart shows EUI by end use and the cumulative impact of each energy efficiency strategy. The output metrics are dynamic and can switch between Energy Cost Savings, EUI, CO2, and other outputs.

This bar chart shows EUI by end use and by month. It's a nice way to "gut check" results. The output metrics are dynamic and can switch between Energy Cost Savings, EUI, CO2, and other outputs.
Included in the competition:

Simple Box Modeling - see sample question below. You are encouraged to come up with your own
November 16, 2021-January 29, 2022