What is the impact of envelope measures on cooling load?
Project Location:
Simulation Scale:
Application:
Audience:
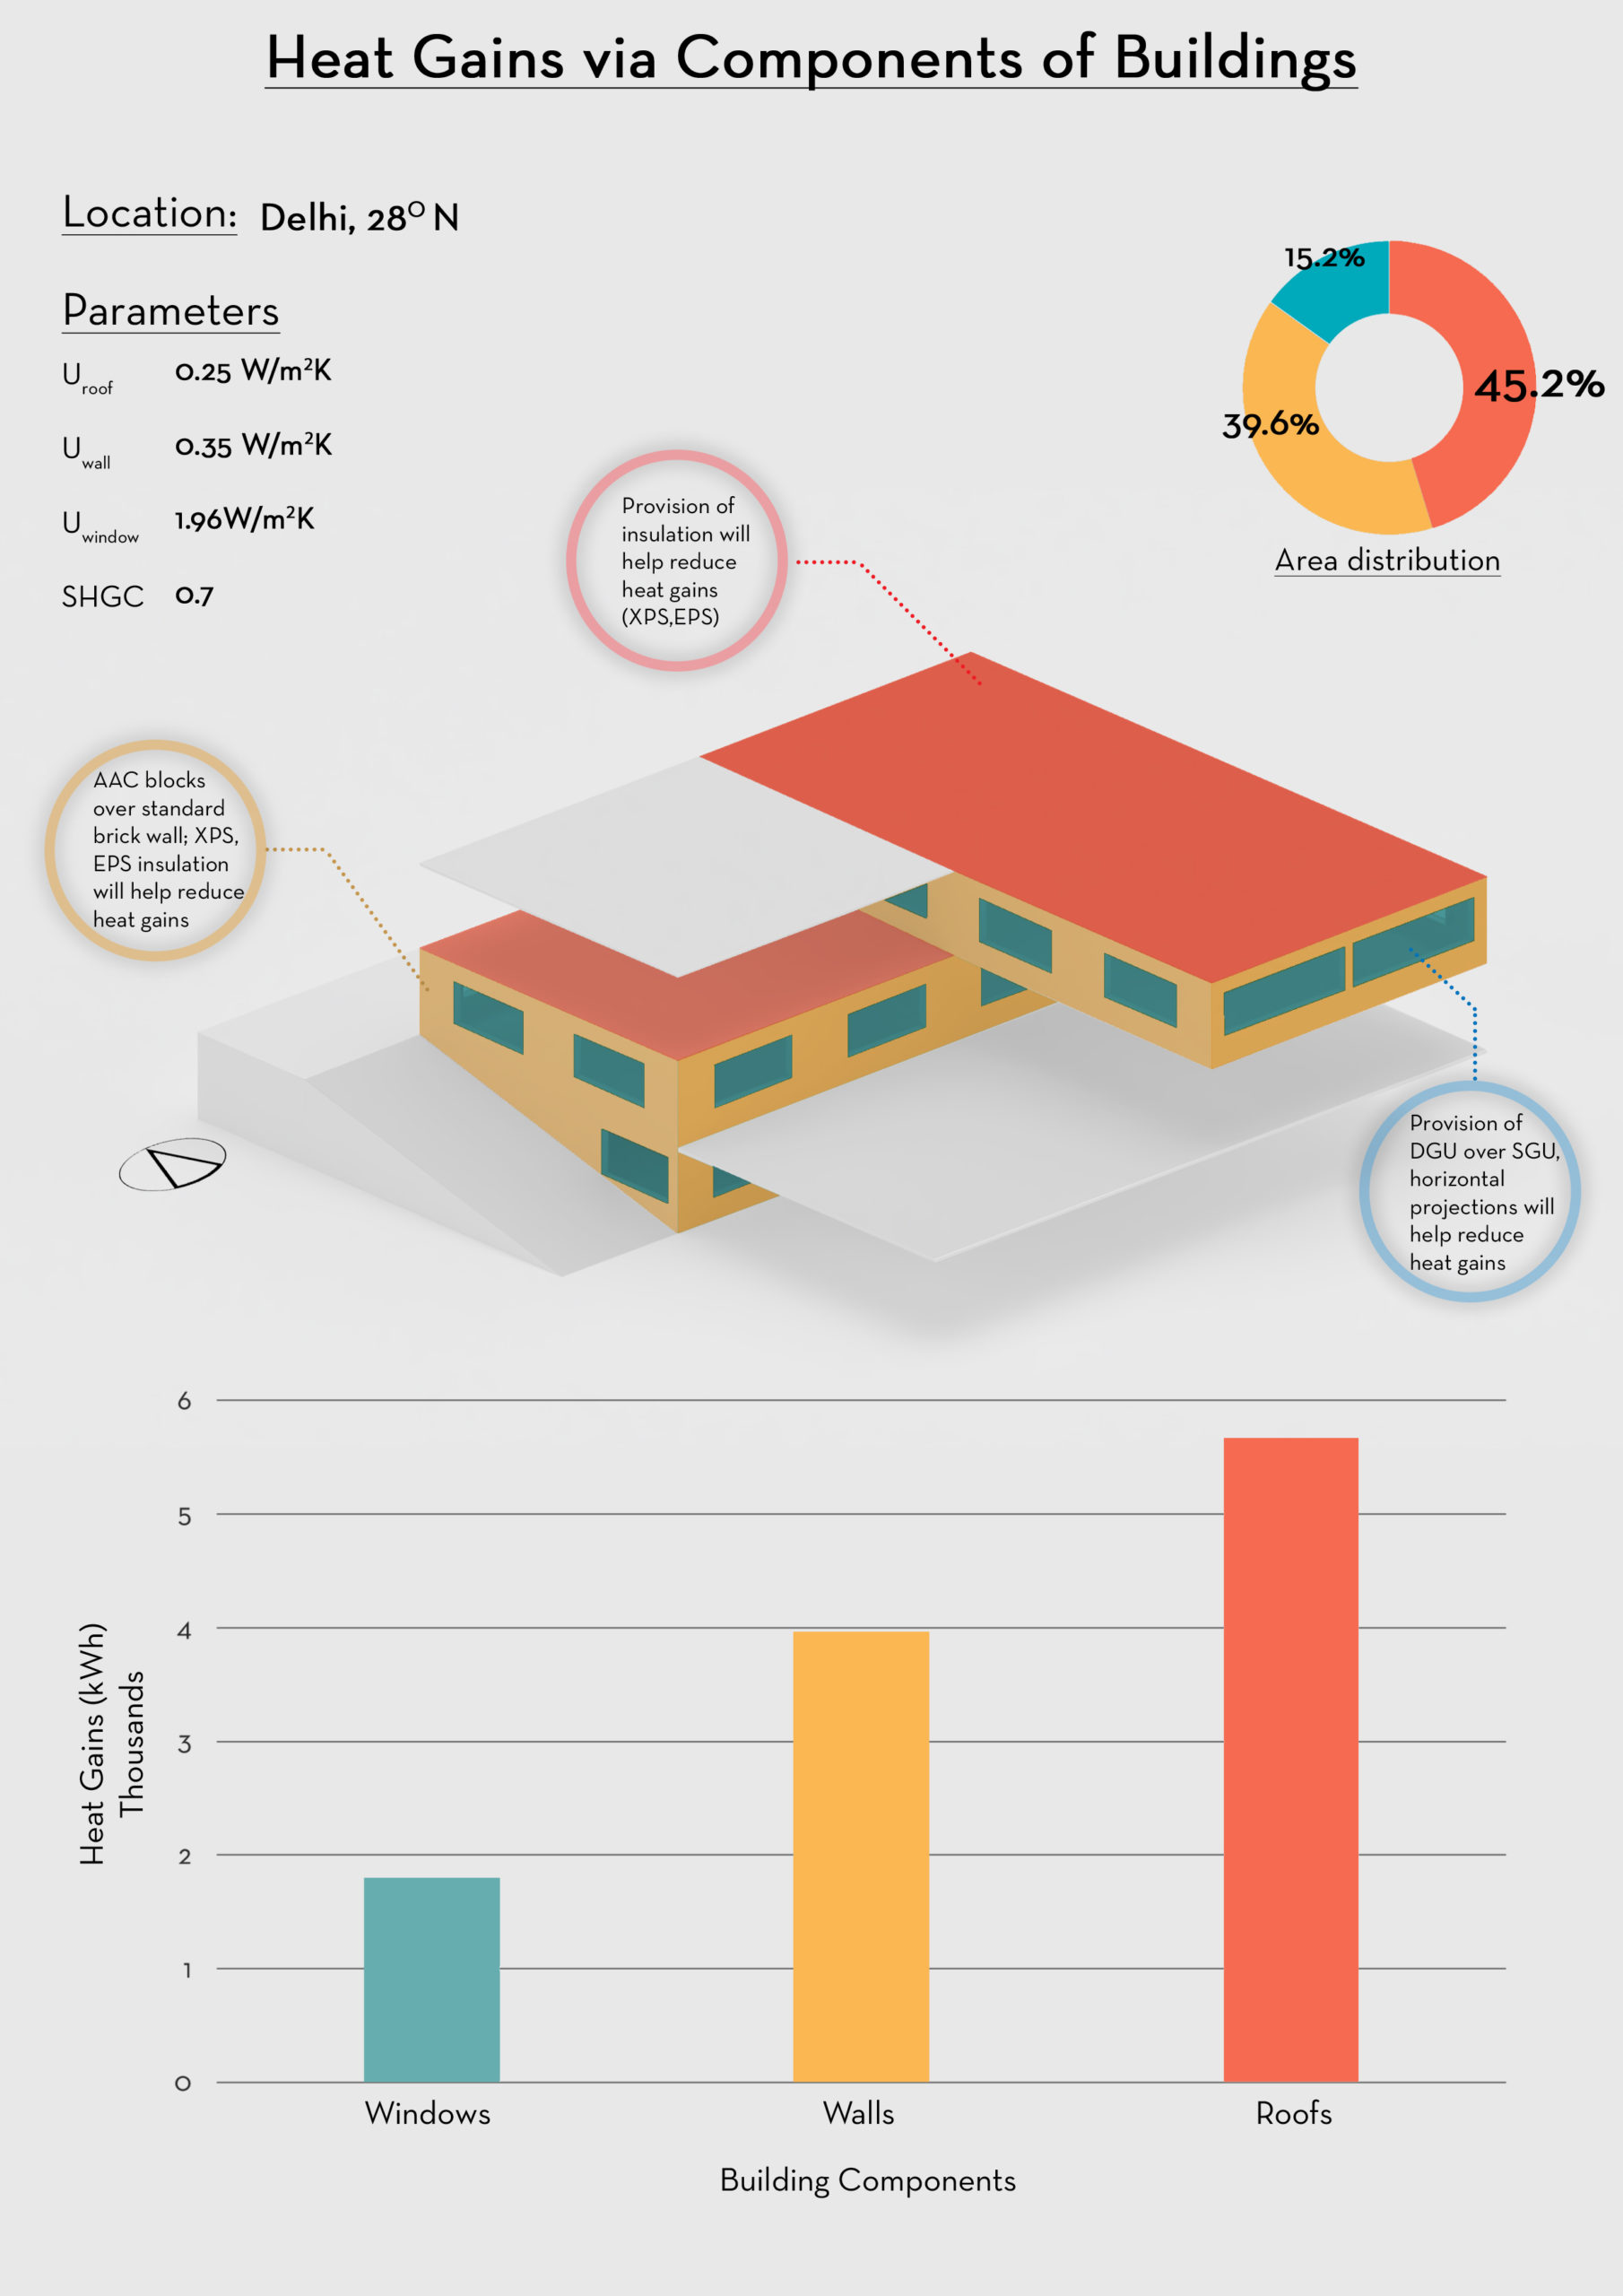
What is this graphic showing? Describe the different parts of the graphic and how it communicates the data.
The above graphic shows the various components of the given building which contribute towards the heat gain through it and hence contributing to the cooling load of the building. The major contributors along with their comparative areas depict the priority of ECMs to be undertaken in order to reduce heat gains. The graph shows the contribution of heat gains inside the building on a cumulative basis for the whole year.
What type of graphic is this?
- Diagram
Is this part of the ASHRAE-209 cycle?
- Cycle 1 Simple Box Model
What tools were used for the simulation analysis?
- Design Builder
What tools did you use to create the graphic?
- Adobe Photoshop
What was successful and/or unique about the graphic in how it communicates information?
The representation of the area wise distribution with its co-relation with heat gains on the graph makes it very easy to interpret the intended data. The color scheme also plays a very important role as it brings the respective aspects of the analysis together.
Is there anything else you would like to mention?