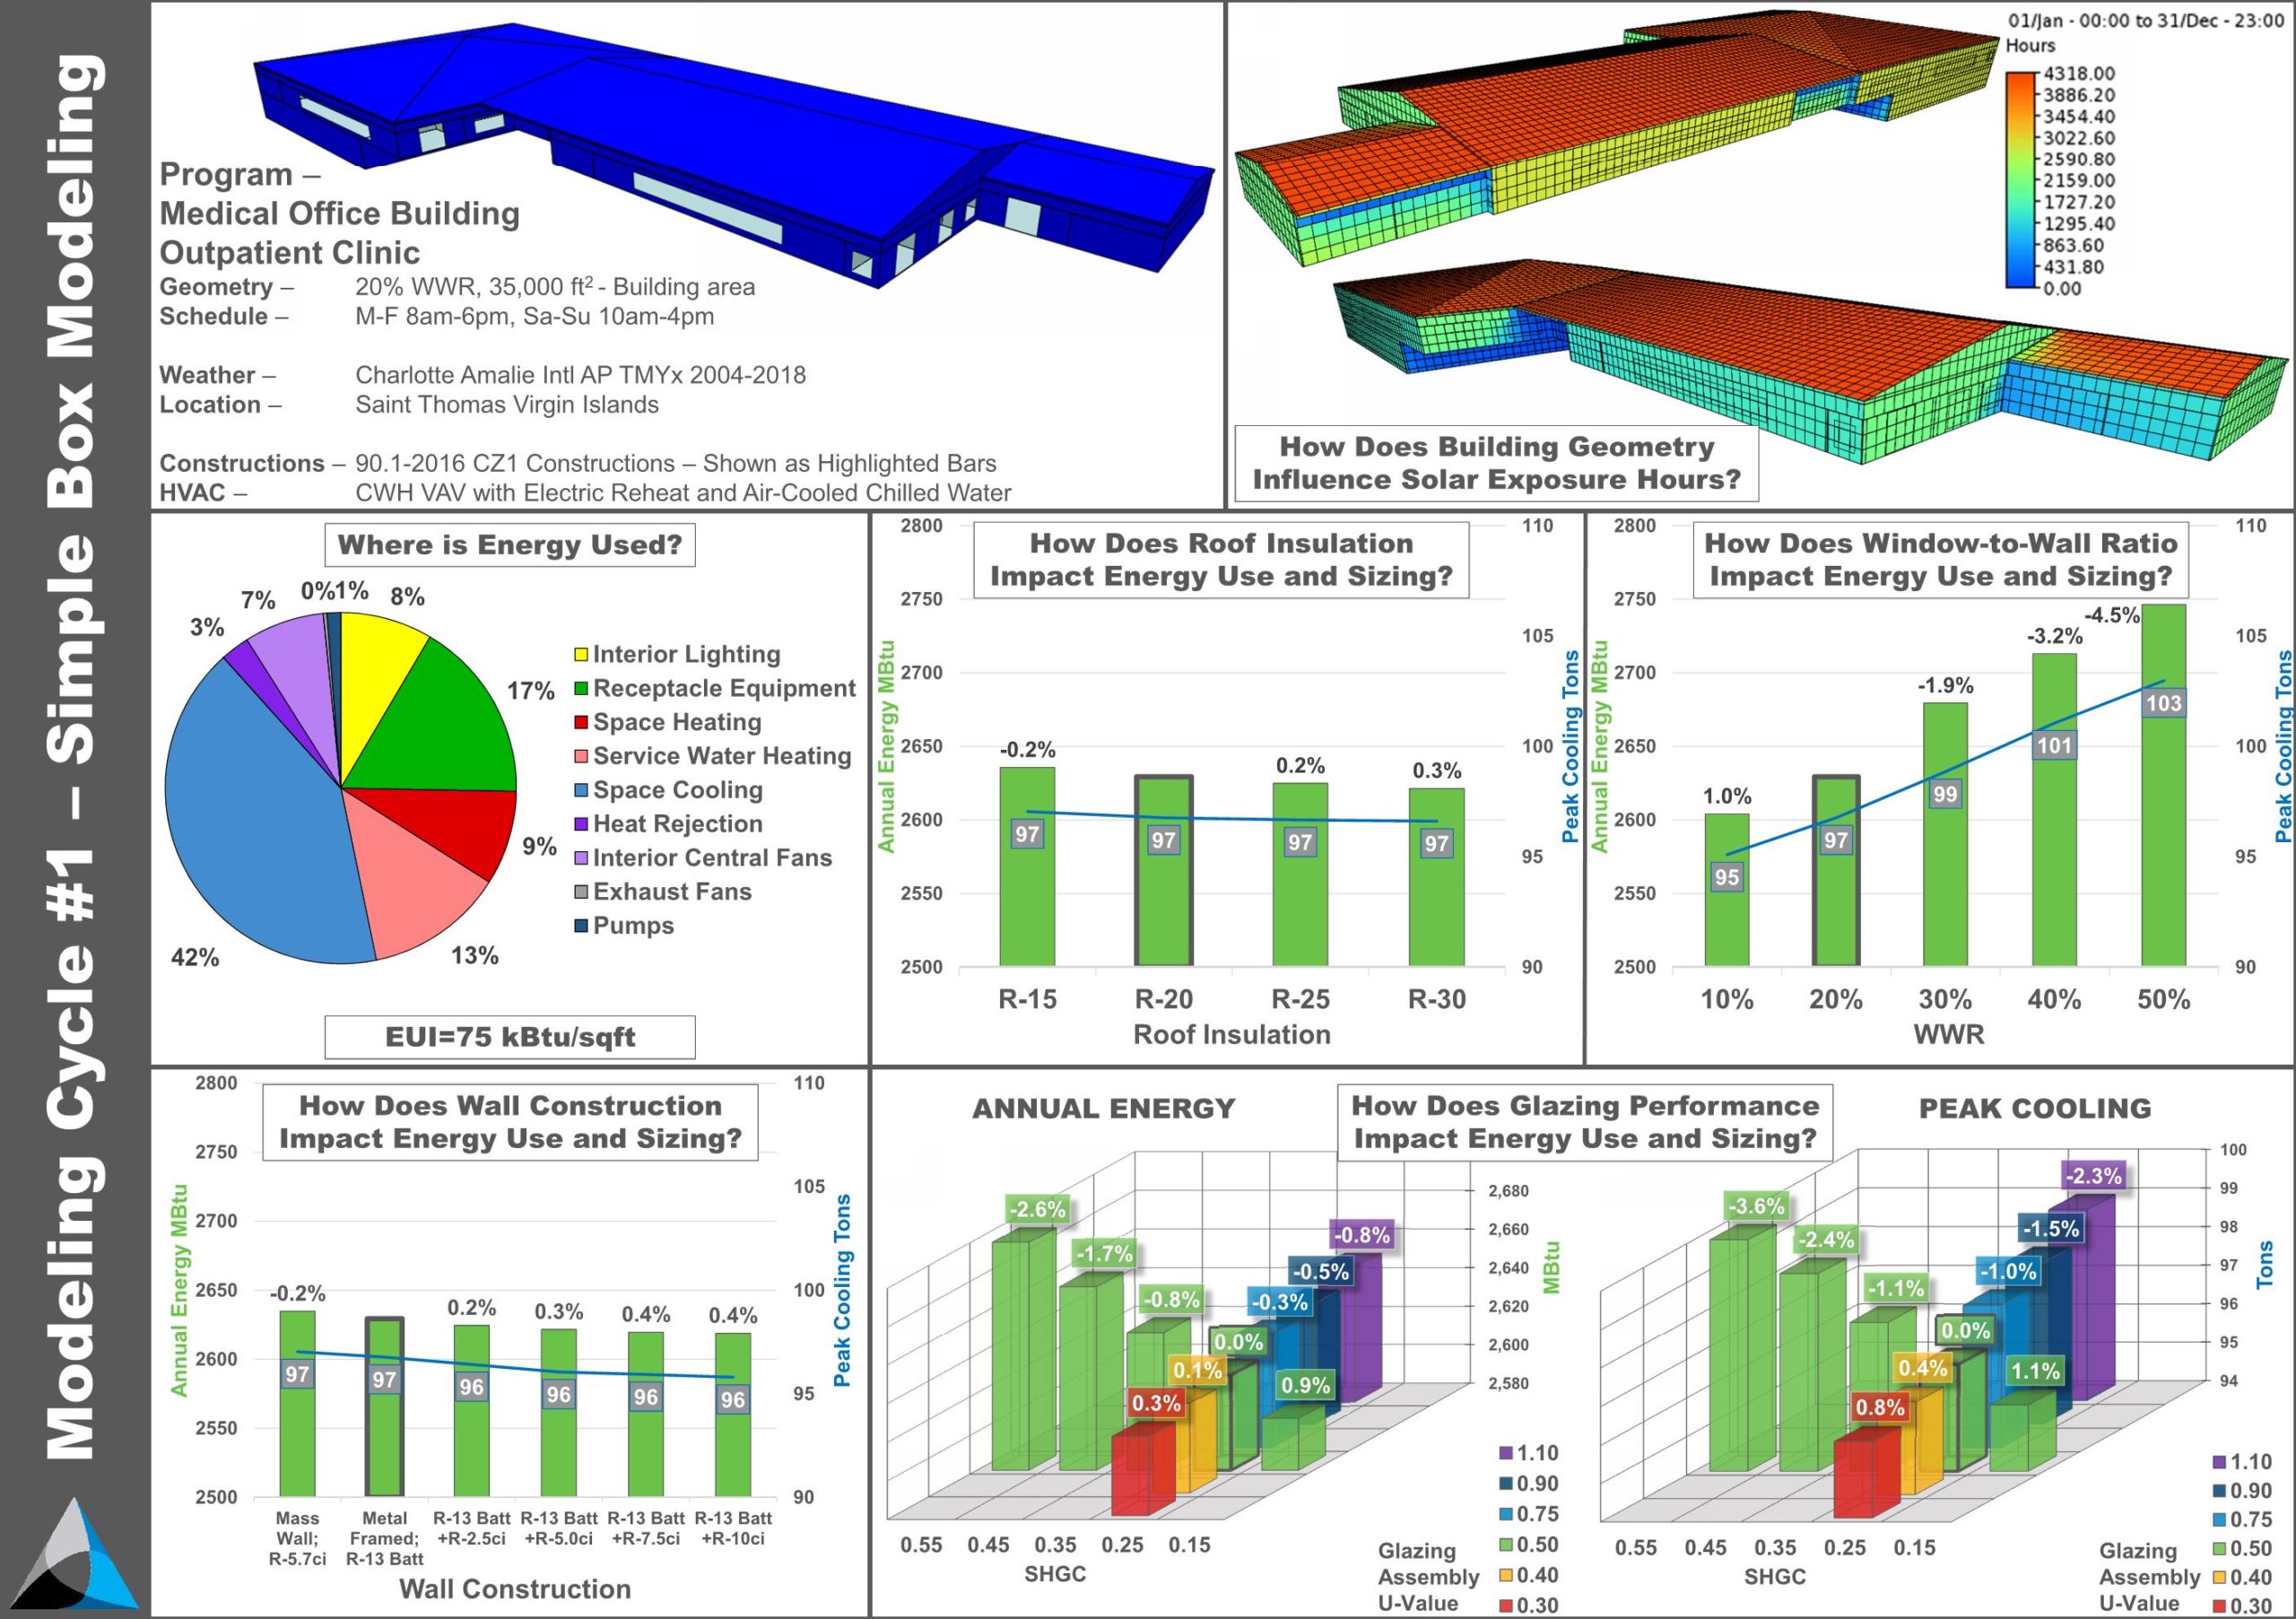
What is the impact of Envelope Performance on Annual Energy Usage and Peak Cooling Load?
Project Location:
Simulation Scale:
Application:
Audience:
What is this graphic showing? Describe the different parts of the graphic and how it communicates the data.
The graphic shows the building energy by end use in order to direct future analysis to target load reduction strategies. Additionally, the building sensitivity to various envelope performance options highlight which design elements can successfully influence the greatest impact on overall building performance.
What type of graphic is this?
- Case Study / Multiple
- Analysis grid
Design Variables
- Glass U-value / SHGC
- Glazing Fraction/Window to Wall ratio
- Insulation R-value
Is this part of the ASHRAE-209 cycle?
- Cycle 1 Simple Box Model
What tools were used for the simulation analysis?
- Excel
- IES-VE
What tools did you use to create the graphic?
- Excel
- PowerPoint
What was successful and/or unique about the graphic in how it communicates information?
The graphic allows all sensitivity analysis to be compared to a single performance scenario. Similar scales allow the visual differences between analyzed options to emphasize the difference in energy performance. Because the intersection of the two analyzed design parameters forms a virtual surface, the glazing performance graphics allow for other assembly options to be estimated and analyzed.
Is there anything else you would like to mention?
Additional credits and other contributors:
Cory Duggin, TLC Engineering SolutionsIncluded in the competition:

Simple Box Modeling - see sample question below. You are encouraged to come up with your own
November 16, 2021-January 29, 2022