What is the impact of facade elements on ASE?
Project Location:
Simulation Scale:
Application:
Audience:
What is this graphic showing? Describe the different parts of the graphic and how it communicates the data.
The graphic is showing the parametric study of façade alternatives that utilize different combinations of protective shading and translucent or spandrel glass to reduce the annual sunlight exposure (ASE) down to levels acceptable by LEED v4.0. A ghosted model of the each façade configuration is shown along with the ASE plot of the interior. Together, the two elements of the image show the design options iterating and how reducing the transparent glazed area and providing solar shading reduced the area with more than 250 hours of ASE down to levels acceptable by LEED v4.0. The challenge of reducing ASE to acceptable levels in such a shallow space with a high degree of west facing glazing was illustrated by the study since many of the configurations studied still not reduce the ASE level far enough to achieve the credit. Yet by combining different strategies, such as replacing some clear glazing with translucent, varying the VLT of the glazing, and introducing exterior shading, the ASE can be reduced enough to be below the threshold for maximum affected area. The parallel coordinates plot shows that there are actually a few different pathways that will work to meet the target, but that a higher VLT glass will require additional shading, or that the length of the shading can be reduced with more protective glass.
What type of graphic is this?
- Animated gif
- Analysis grid
- Parallel coordinates
Design Variables
- Window shading/sun control
What tools were used for the simulation analysis?
- DIVA
What tools did you use to create the graphic?
- Other
What was successful and/or unique about the graphic in how it communicates information?
The animation shows both the façade configuration and the resulting area with ASE which connects the design to the result spatially. It also shows the dynamic iteration that took place to provide a few different options that could help meet the ASE criteria of the daylight credit.
Is there anything else you would like to mention?
Supplementary Graphics
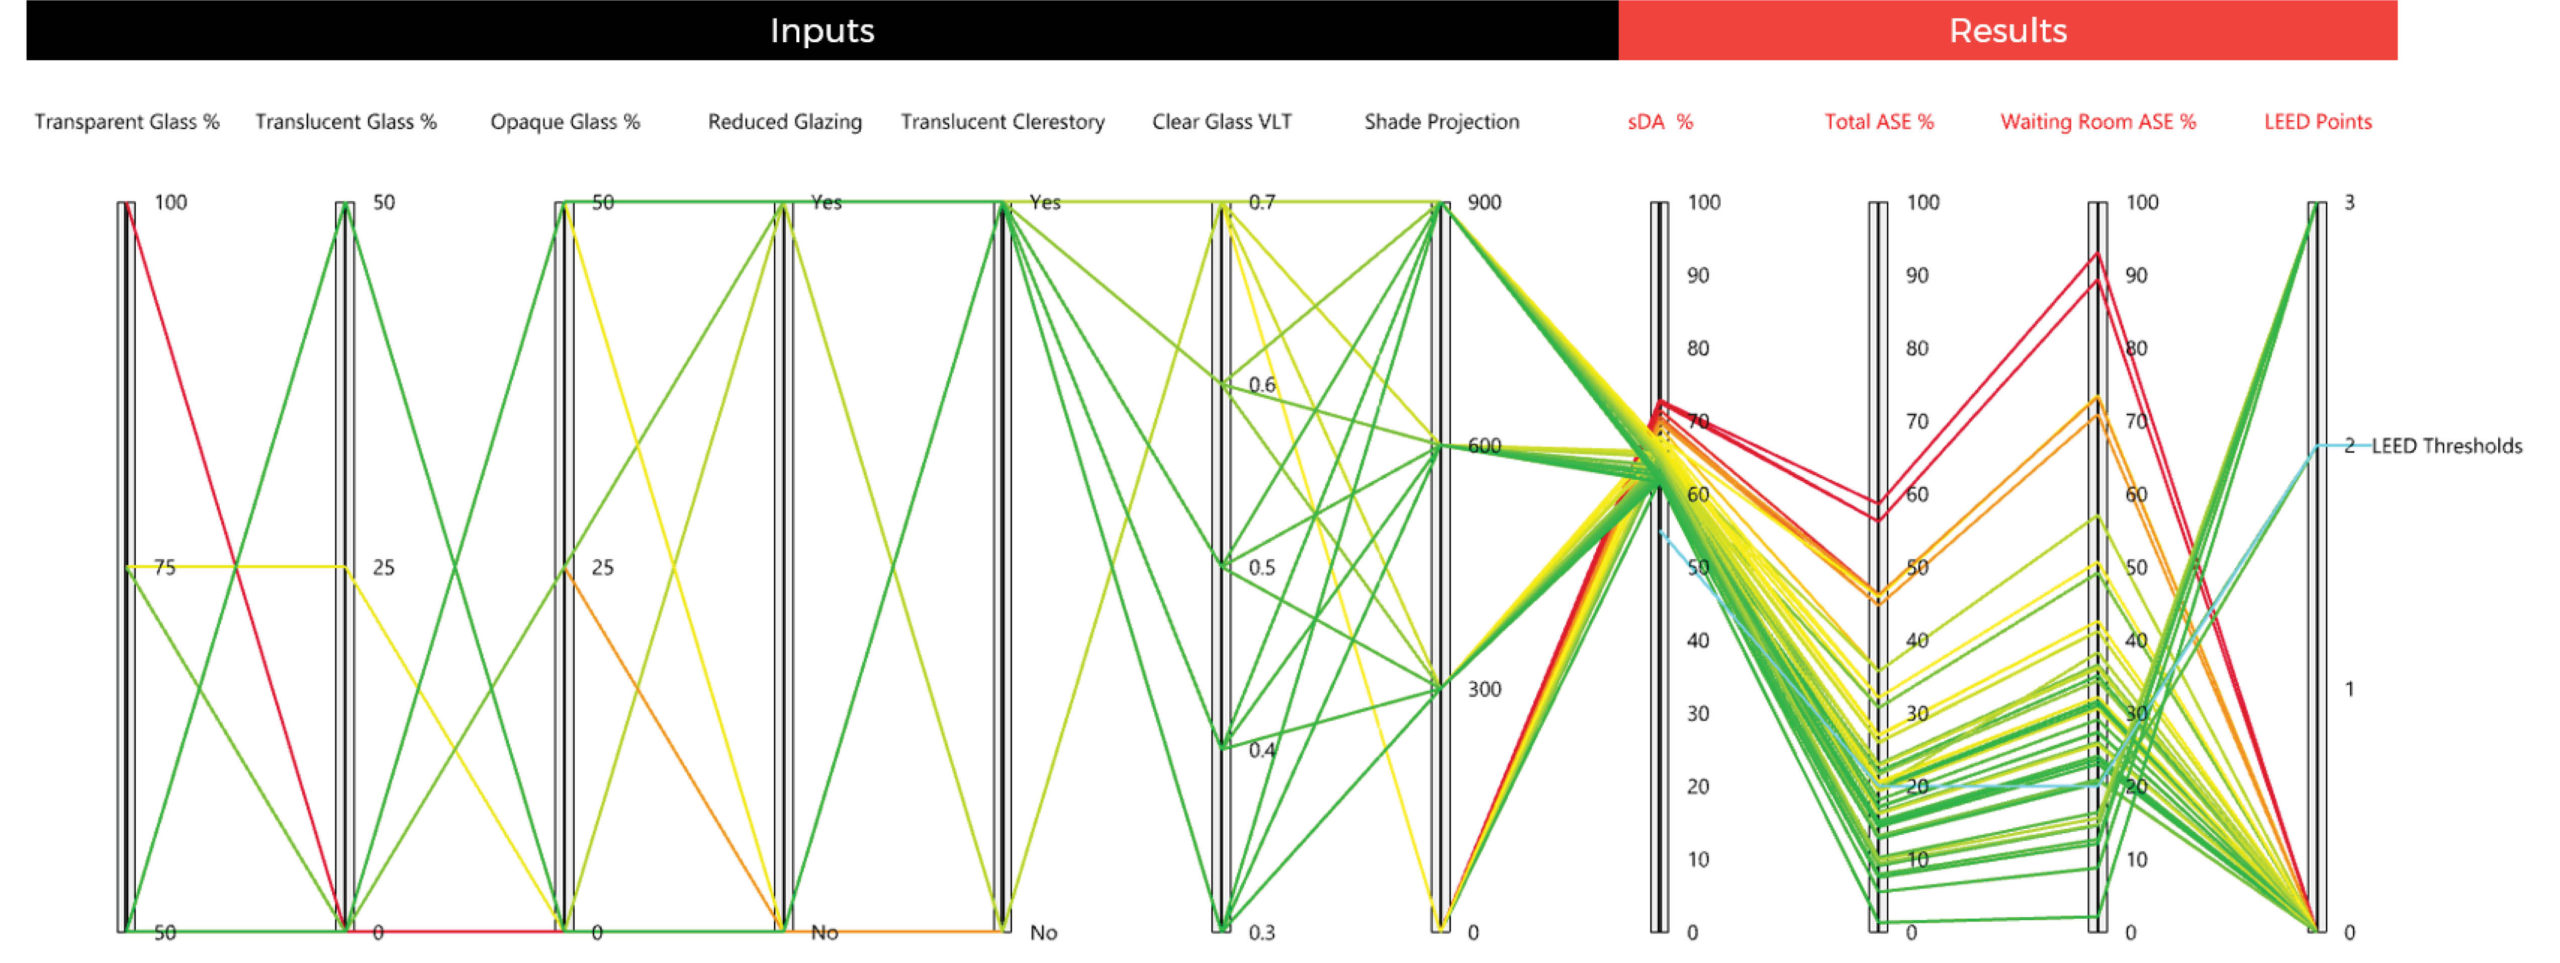
Parallel coordinates graph of the different options studied in the animation
Included in the competition:
Daylighting and Glare with Side Lighting
July 15, 2021-September 20, 2021