What is the impact of Glazing to Wall Ratio on Cooling Loads?
Project Location: Cwa
Simulation Scale: Floor Plate
Application: Conceptual
Audience: Academic
What is this graphic showing? Describe the different parts of the graphic and how it communicates the data.
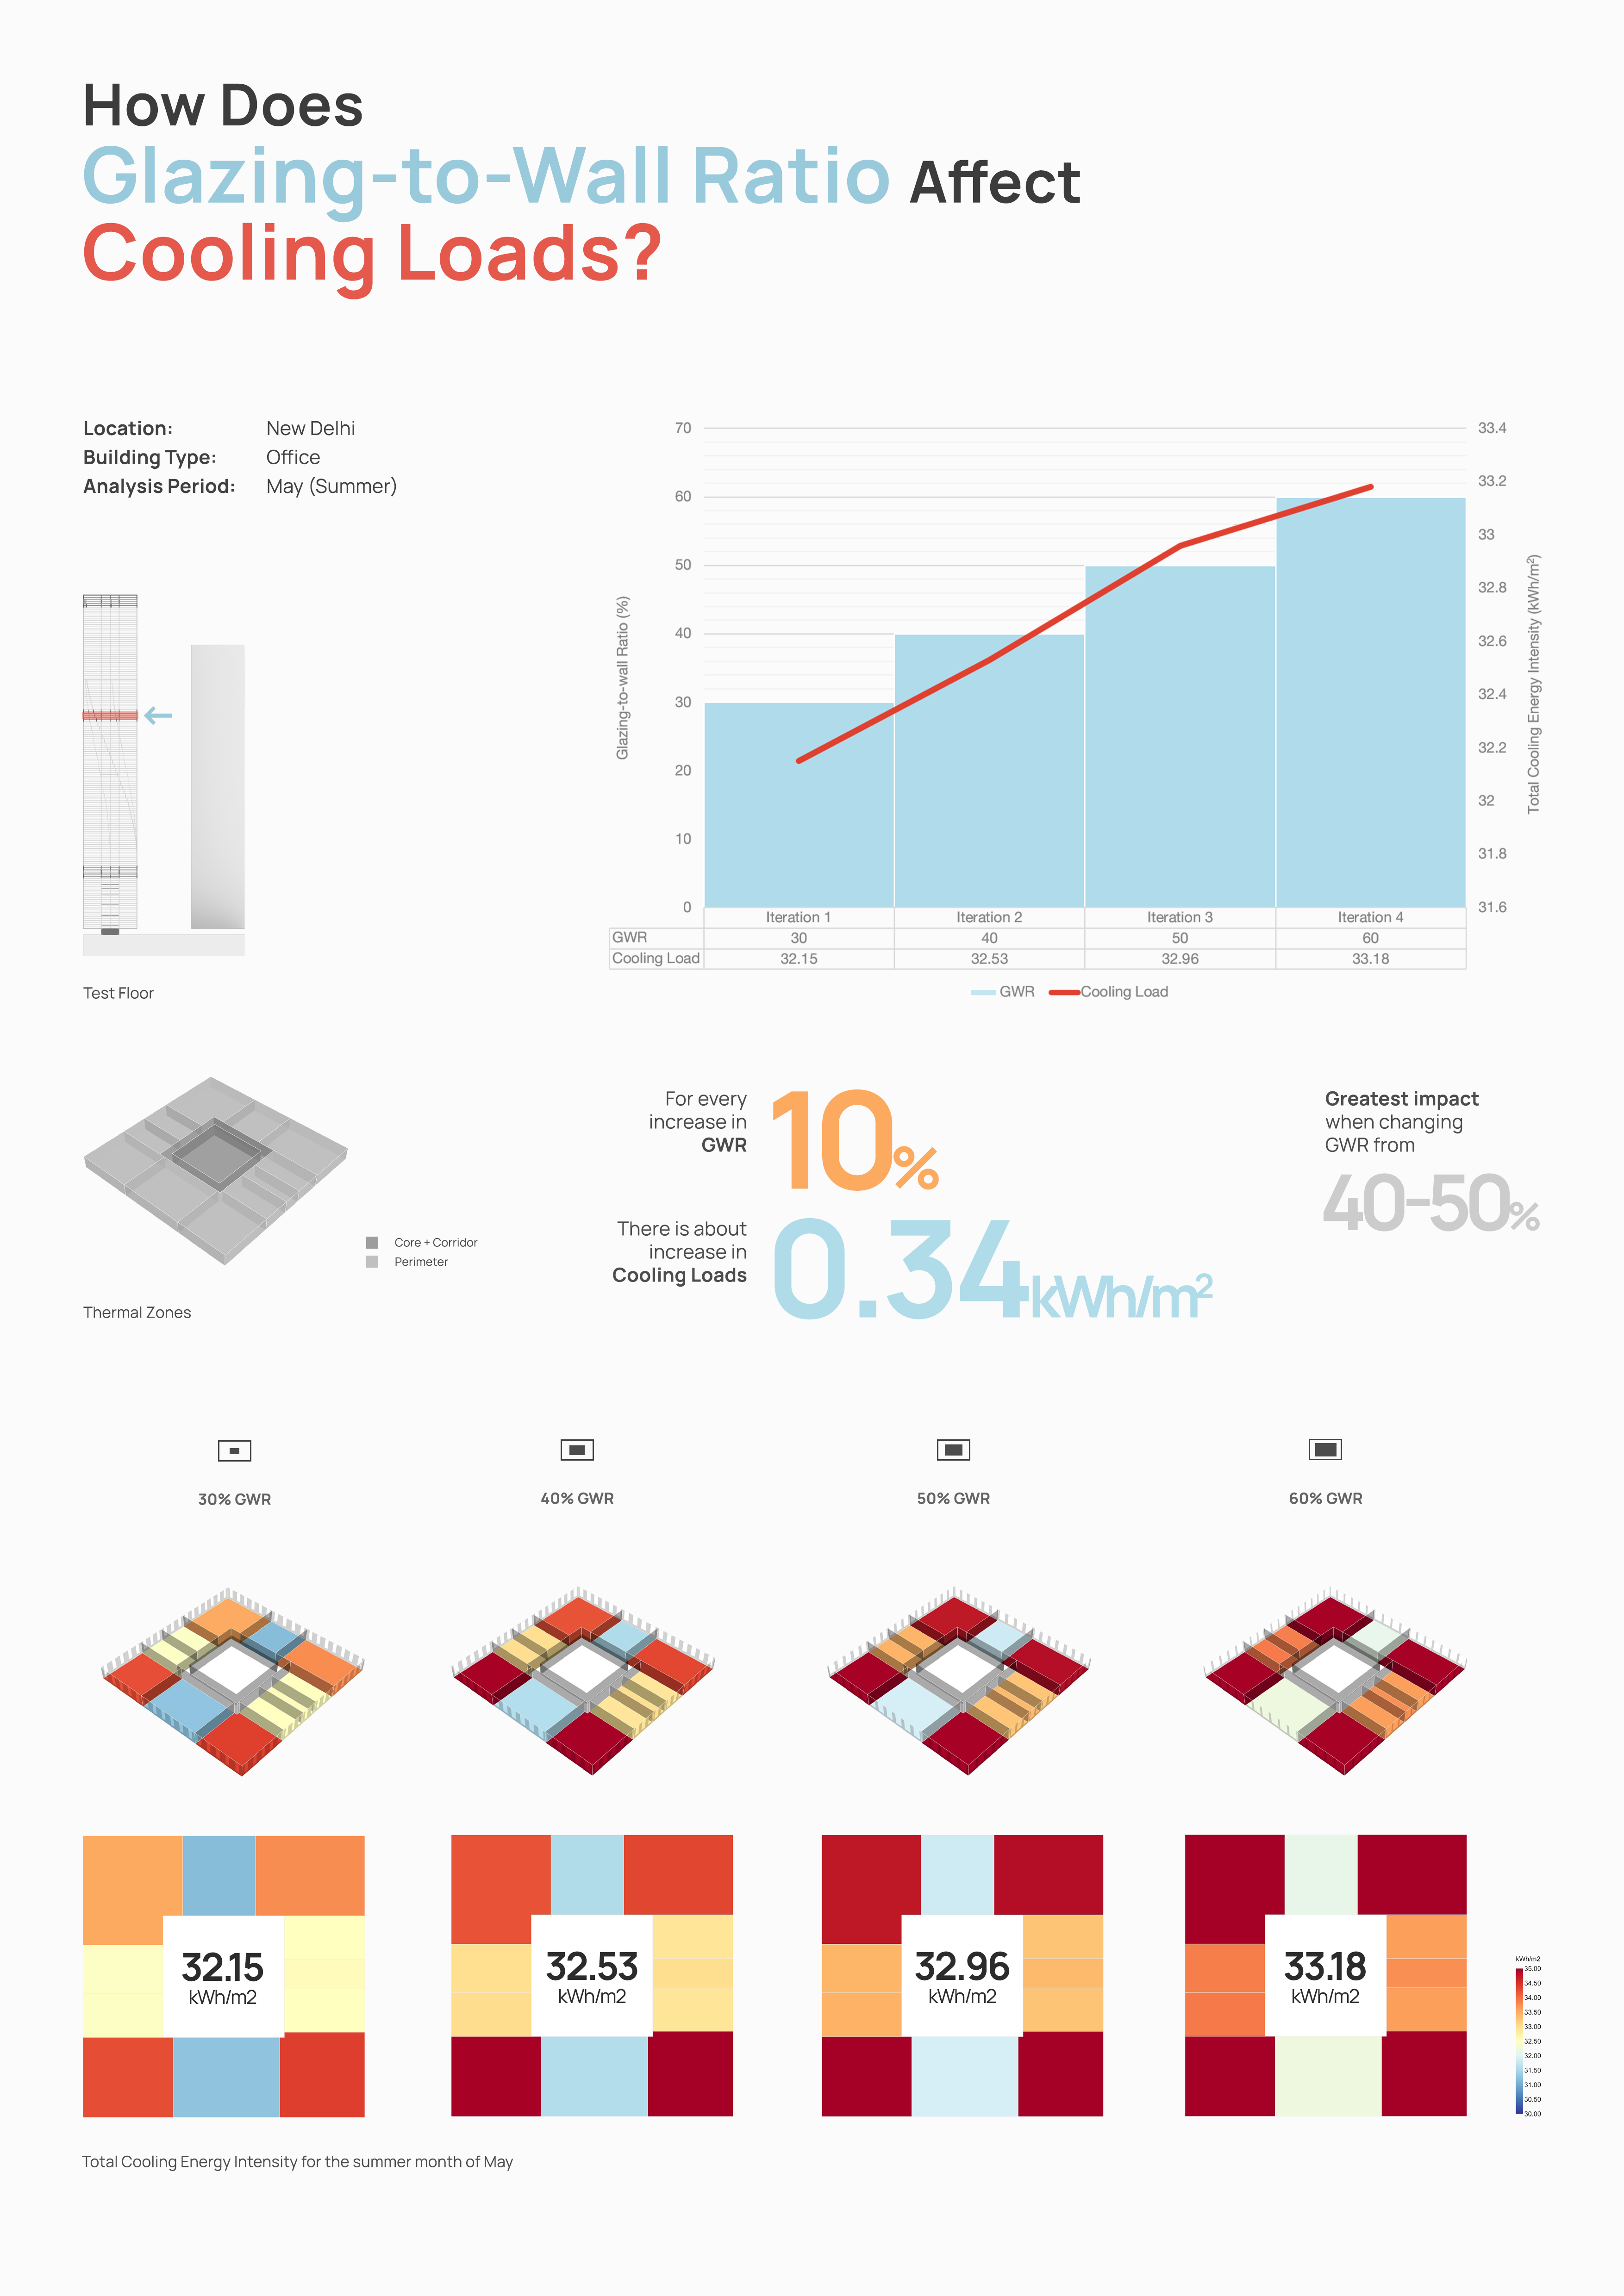
The graphic showcases the impact of various glazing-to-wall ratios (GWR) on sensible cooling loads for a floor plate located in the middle section of a high-rise office building. An occupancy schedule of 0800 to 1800 hours with weekends off was chosen for the analysis for the summer month of May. The ratios for each scenario remain same for all four facade orientations, and their corresponding effect on cooling energy intensity is observed.
What type of graphic is this?
- Diagram
Design Variables
- Glazing Fraction/Window to Wall ratio
Is this part of the ASHRAE-209 cycle?
- Cycle 2 Conceptual Design
What tools were used for the simulation analysis?
- EnergyPlus
- Ladybug Tools
What tools did you use to create the graphic?
- Adobe Photoshop
- Grasshopper/Rhino
- PowerPoint
What was successful and/or unique about the graphic in how it communicates information?
The analysis clearly shows that higher window-to-wall ratio contributes to higher cooling loads, as the perimeter zones turn from shades of blue and yellow to shades of red. All four scenarios show that for every 10% increase in WWR, there is about 1.05% increase in the cooling energy intensity.
Is there anything else you would like to mention?
The maximum increase in cooling loads is observed when changing the WWR from 40% to 50%.