What is the impact of Natural Ventilation on Cooling Electricity Consumption??
Project Location:
Simulation Scale:
Application:
Audience:
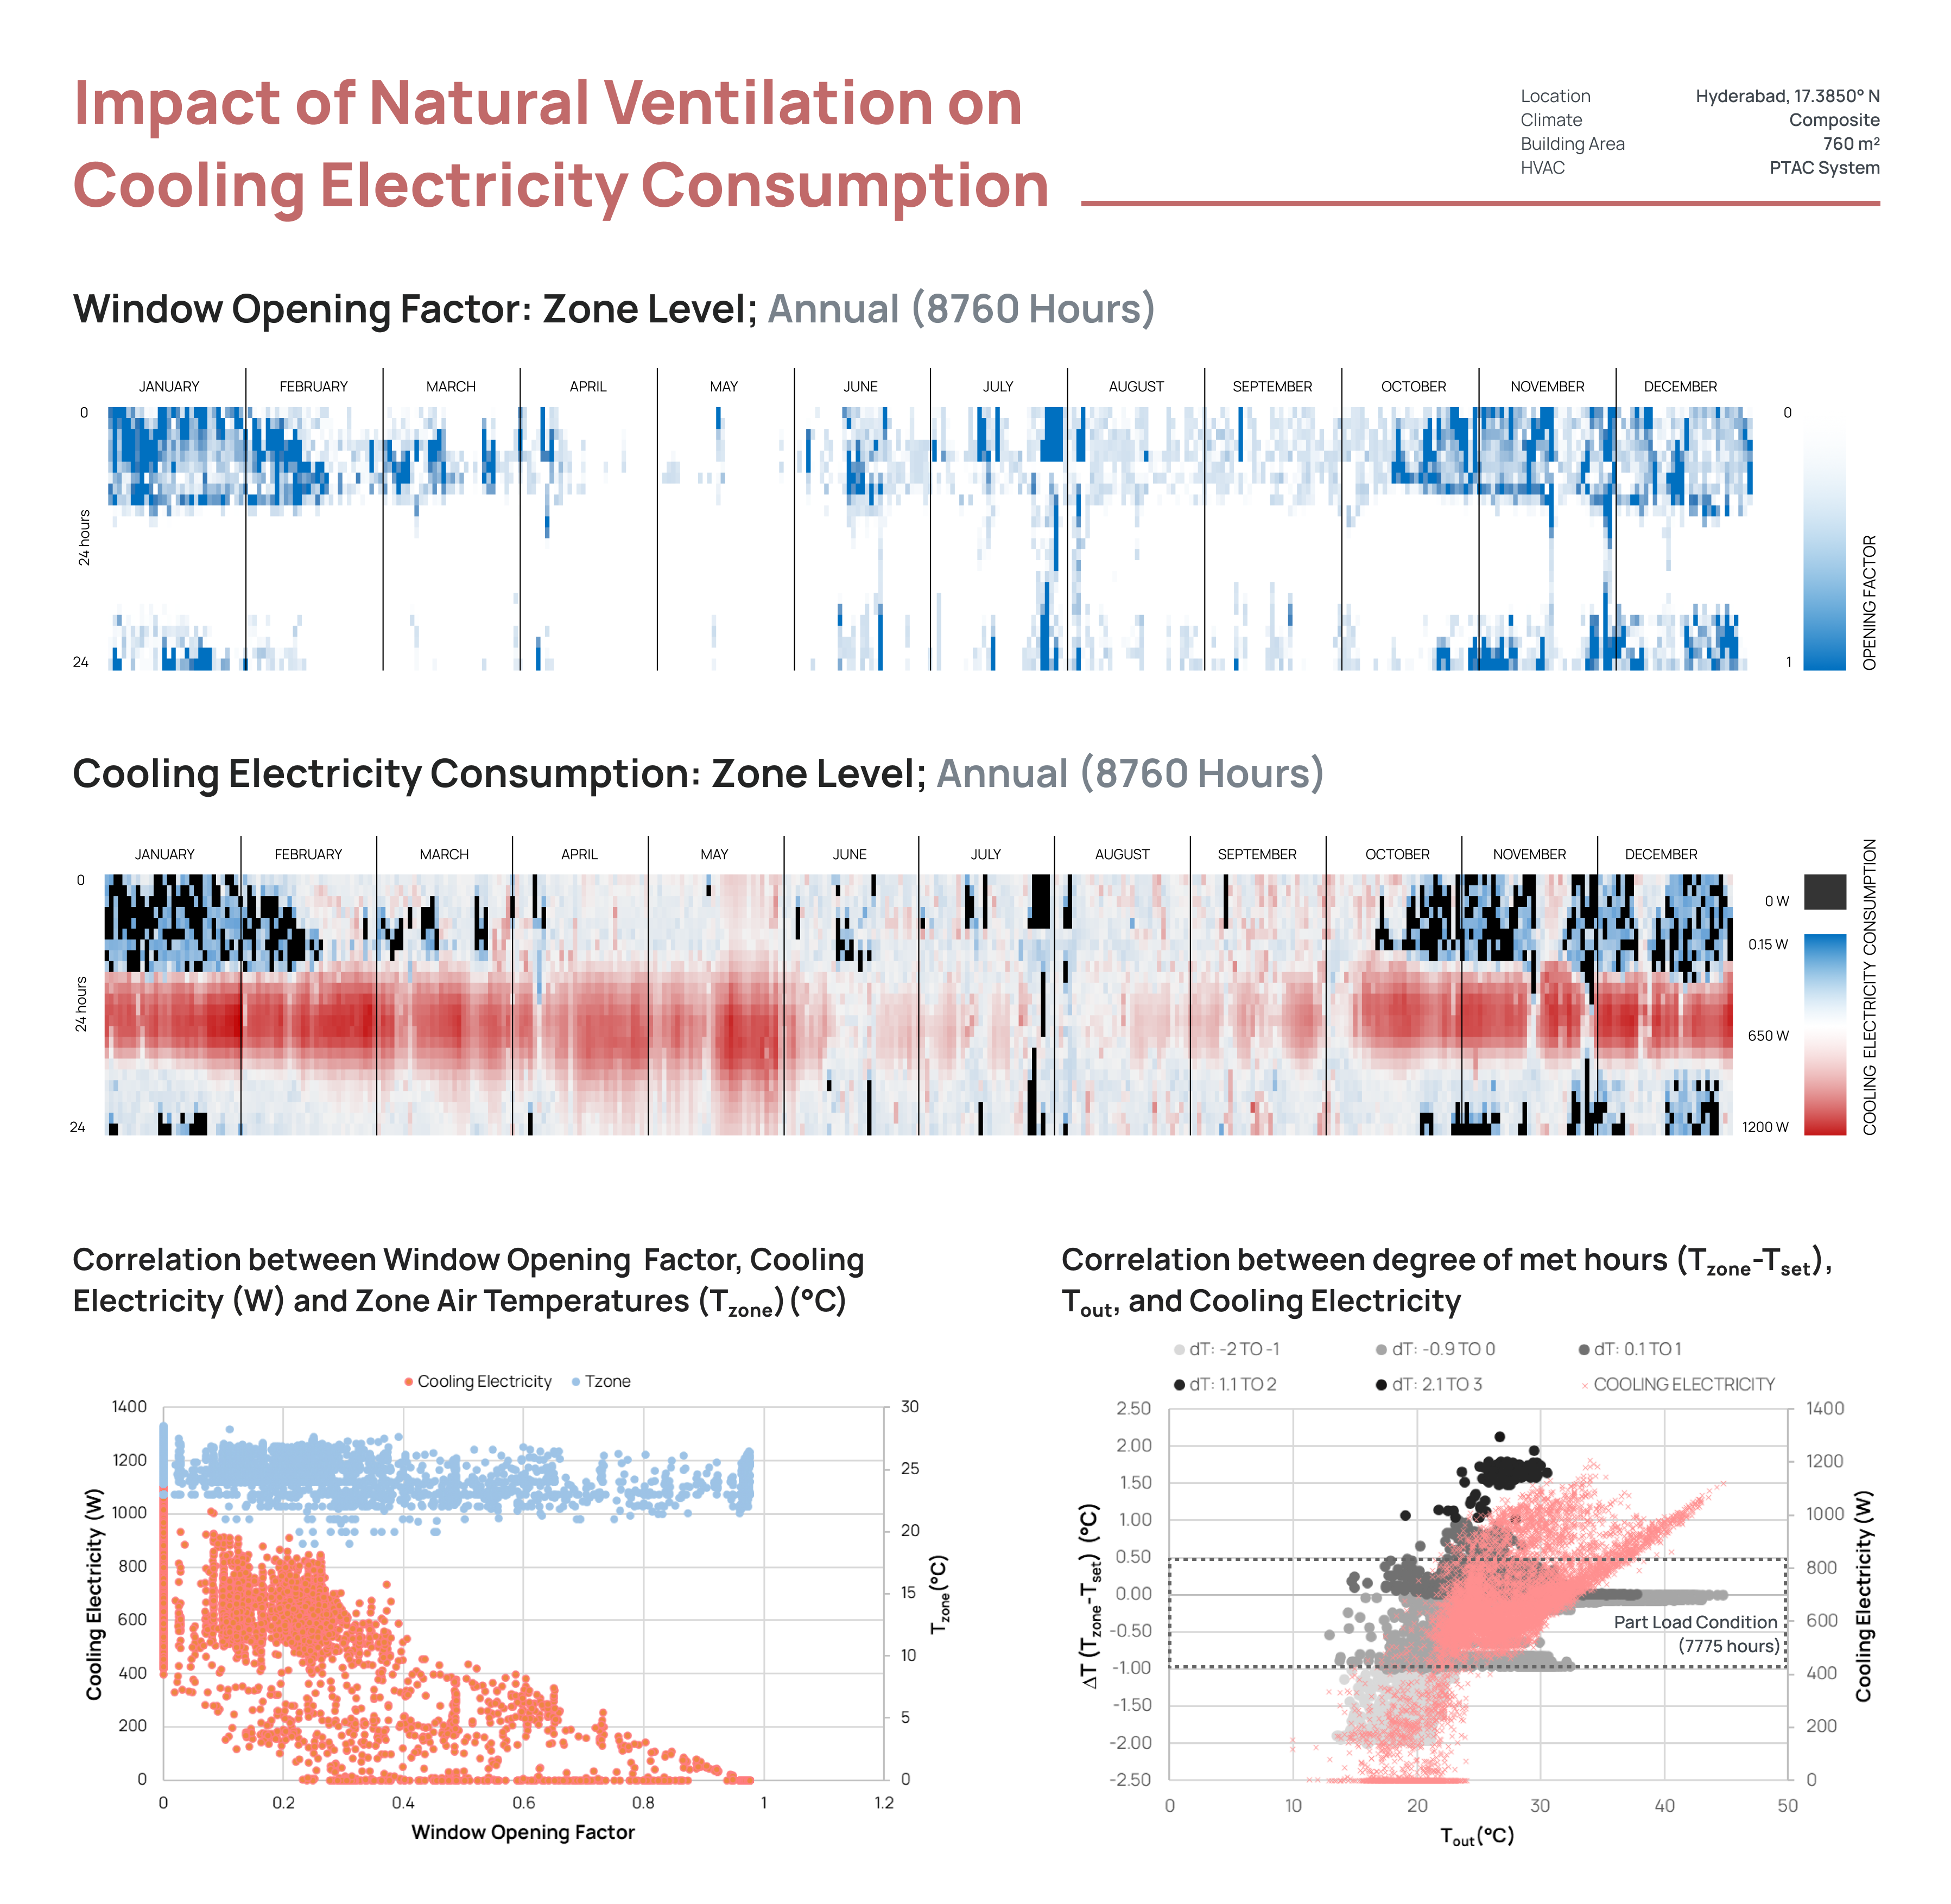
What is this graphic showing? Describe the different parts of the graphic and how it communicates the data.
The graphic intends to show the impact of natural ventilation through window opening in a mixed mode building on the annual energy consumption pattern. The heat maps depicts the window operation and energy consumption based on Energy Plus logic for natural ventilation which states 'If Zone Air Temperature (Tzone) > Outdoor Temperature (Tout) and Tzone > Zone Setpoint Temperature (Tset) and Ventilation Schedule = 1, then Window Opening Factor >0. EPI for a mixed mode building 107 kW/m2/year which is 39% lower than basecase where the building is completely air conditioned.
What type of graphic is this?
- Table / Chart
Design Variables
- Other
- Passive strategies
What tools were used for the simulation analysis?
- Design Builder
- EnergyPlus
- Excel
What tools did you use to create the graphic?
- Adobe Indesign
- Excel
- Other
What was successful and/or unique about the graphic in how it communicates information?
The graphic is able to manifest the relationship between window operation corresponding to natural ventilation and the reduction in energy consumption to zero for fully open windows. Additionally, the correlation between the degree of met hours (thermal comfort hours) and cooling electricity consumption gives us a clear picture of part load, seasonal and peak load conditions.
Is there anything else you would like to mention?
This analysis was done as a part of the classroom exercise under master's in Building Energy Performance at CEPT University, Ahmedabad, India, under the guidance of Professor Rajan Rawal.
Included in the competition:

What is the impact of Natural Ventilation on indoor comfort and energy use?
March 17, 2022-May 31, 2022