What is the impact of natural ventilation on energy efficiency in a hot humid climate depending on orientation, wind direction, speed and placement of opening?
Project Location:
Simulation Scale:
Application:
Audience:
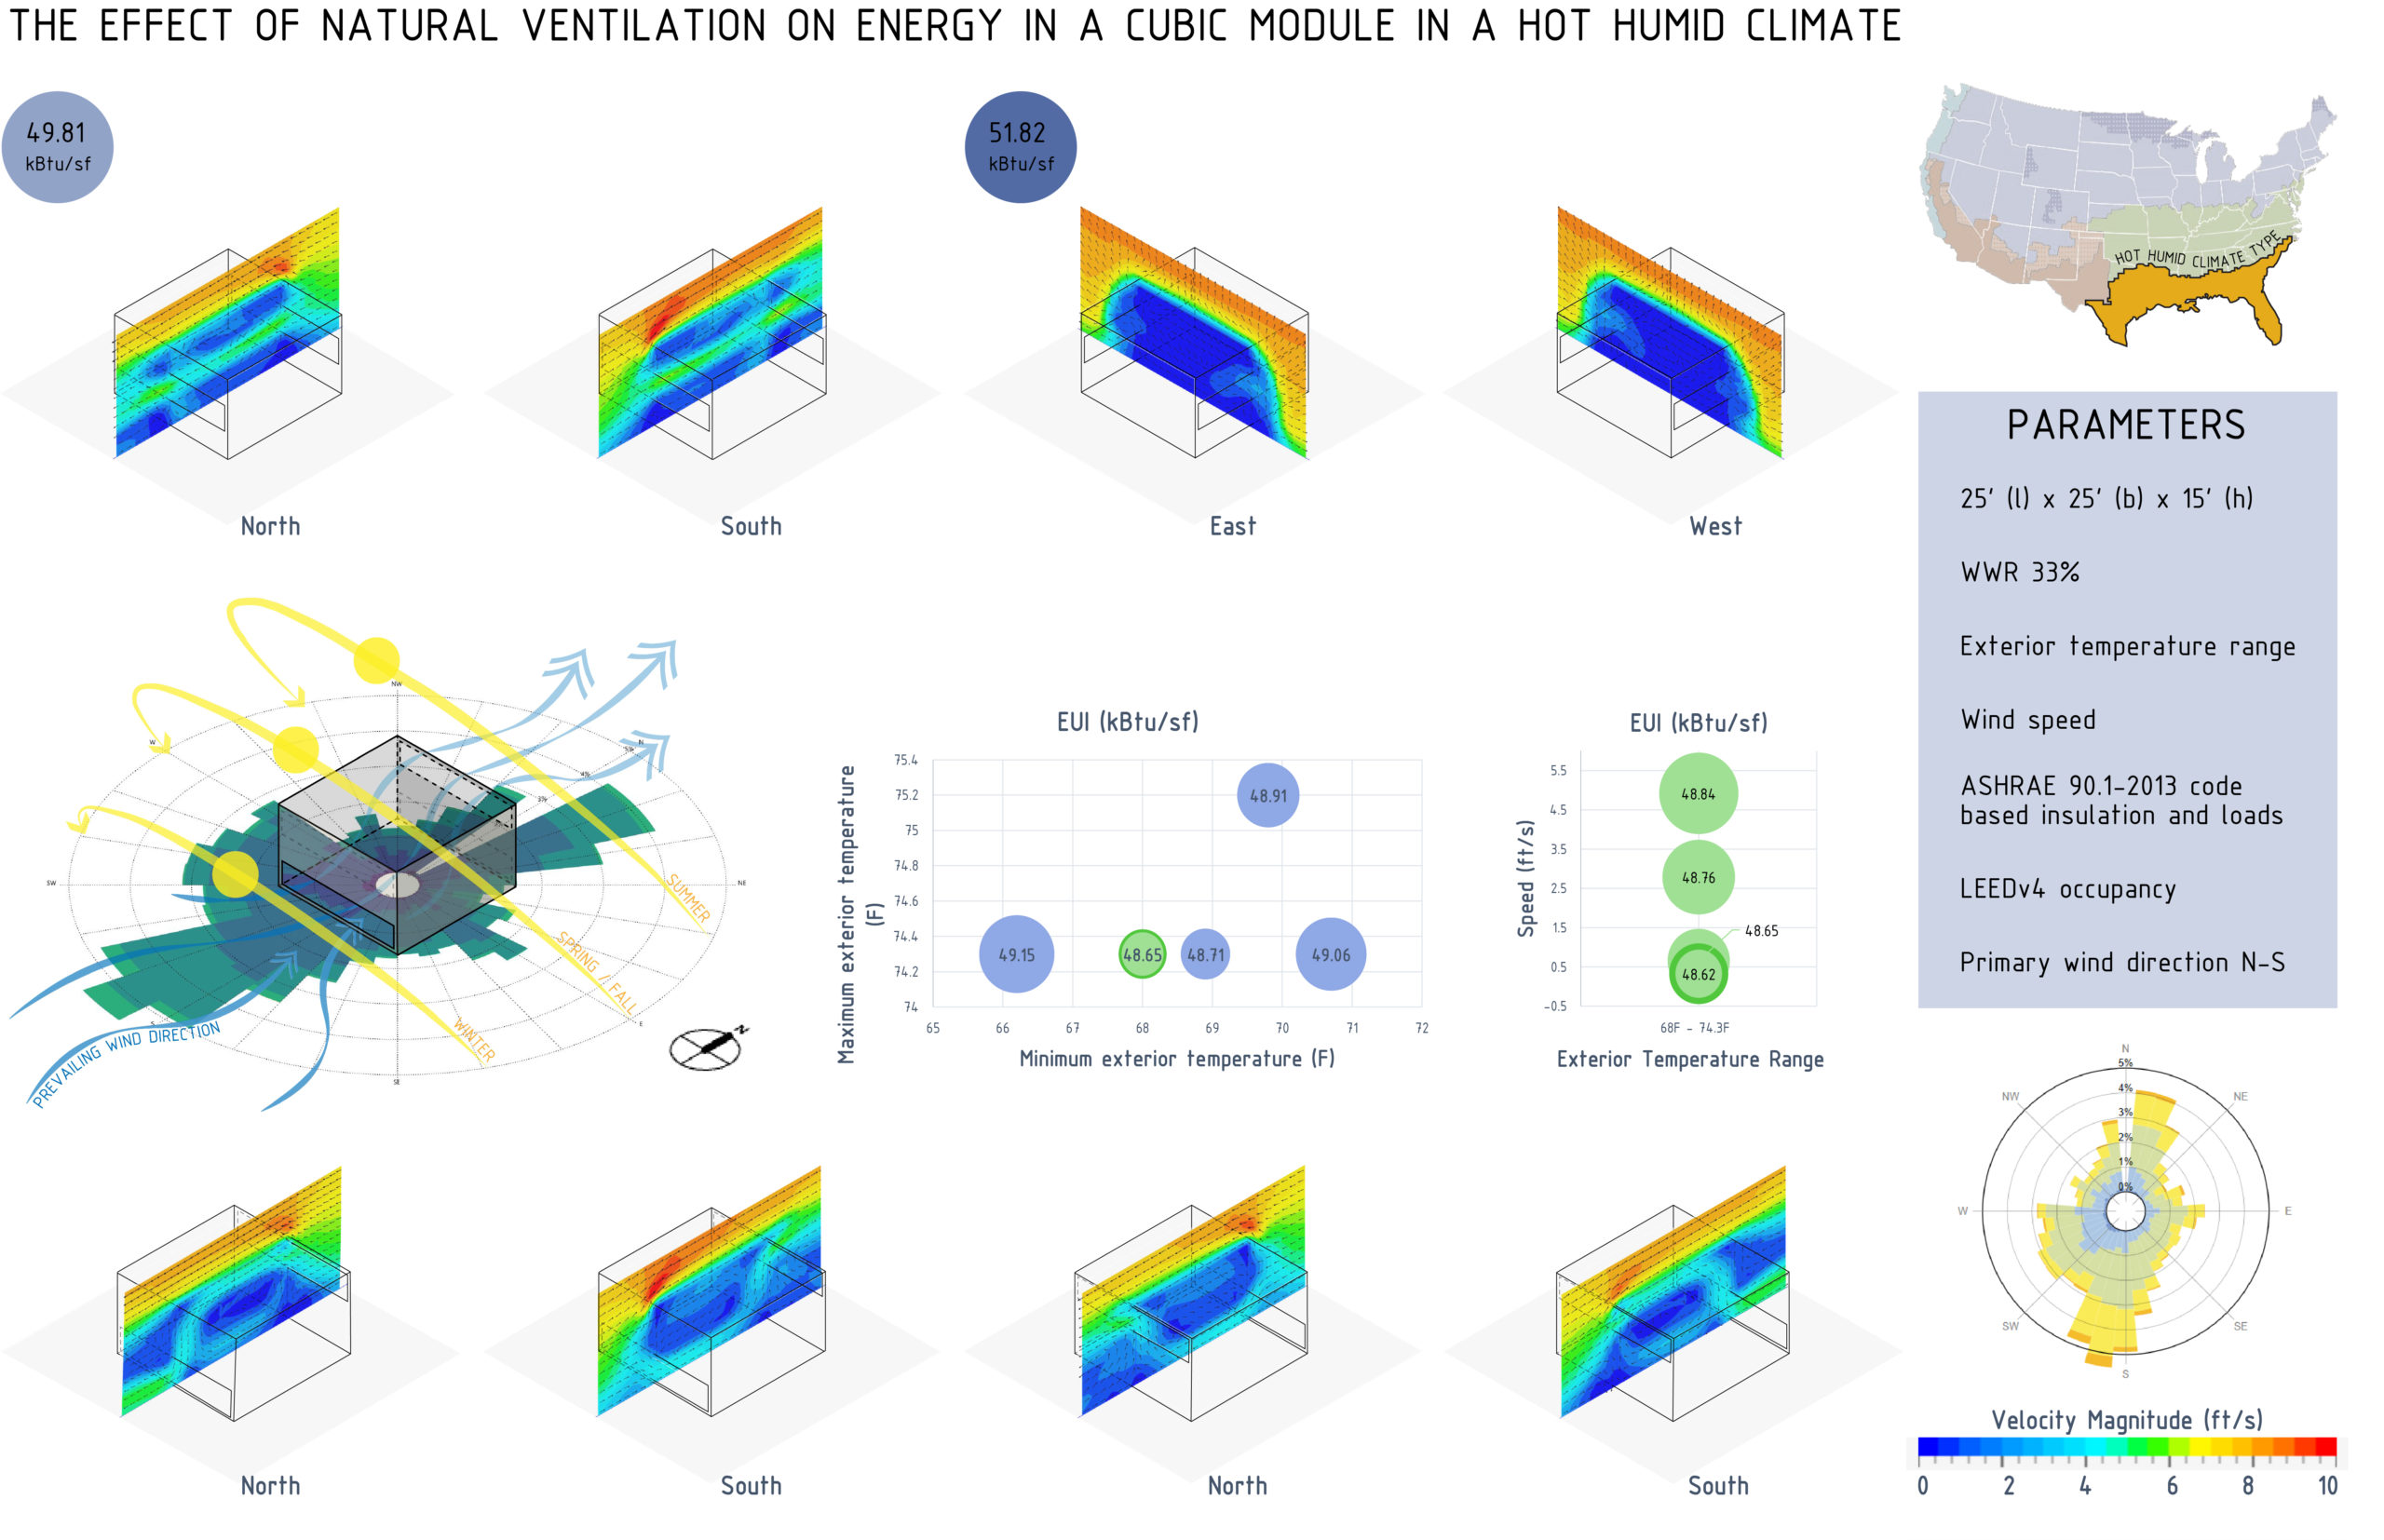
What is this graphic showing? Describe the different parts of the graphic and how it communicates the data.
The first row of graphics depicts the effect of the four cardinal wind directions, and the resulting energy consumption depending on orientation. This first study was done to identify the most energy-efficient orientation of the opening, as well as the predominant direction of the wind. After identifying that North-South was the most optimal orientation, some parameters were analyzed to maximize energy efficiency using natural ventilation. The first parameter studied was the exterior temperature. Allowing the windows to open between 68F and 74.3F was determined to be the most energy-efficient solution. Plotted on the first graph, it represents the energy consumption of the module while using natural ventilation at the prevalent wind speed through a fixed opening during certain minimum and maximum outdoor temperatures. The maximum exterior temperature is represented on the y-axis and the minimum on the x-axis. The second parameter studied was the wind speed. After fixing the optimal exterior temperature range, the conclusion was that lower speeds helped keep a more steady temperature and use less energy. The second graph is a sequence from the first study where once delimited the optimal temperature range, it analyzed the effect of the wind speed over energy. The x-axis is the fixed temperature range and the y-axis represents the wind speed. After running the energy simulations for the mentioned parameters, the window’s vertical location was analyzed as a further variable. Two studies performed for location of the openings along with North and South directional wind, helped identify that a cross location would allow more natural ventilation in the space.
What type of graphic is this?
- Analysis grid
- Diagram
- Other
- Table / Chart
Design Variables
- Other
- Passive strategies
Is this part of the ASHRAE-209 cycle?
- Cycle 1 Simple Box Model
- Cycle 2 Conceptual Design
- Cycle 3 Load Reduction
What tools were used for the simulation analysis?
- Computational Fluid Dynamics
- EnergyPlus
- Ladybug Tools
- OpenStudio
What tools did you use to create the graphic?
- Adobe Illustrator
- Adobe Photoshop
- Excel
What was successful and/or unique about the graphic in how it communicates information?
The wind simulation graphics show velocity in a sectional plane. Having openings on the lower side for incoming wind and higher side for outgoing wind is most beneficial for natural ventilation in hot humid climates. The graphs help understand the varying effects on energy. This exploration shows the benefit of maximizing natural ventilation opportunities in design helps to minimize EUI.
Is there anything else you would like to mention?
This study is intended to be an early stage, quick, general analysis of the effect of natural ventilation in energy and occupant comfort; the intent is not to represent detailed results. A more complete study would be generating results based on opening size and location on the façade.
Additional credits and other contributors:
Laia Gimeno Orti (Equal contributor)Included in the competition:
What is the impact of Natural Ventilation on indoor comfort and energy use?
March 17, 2022-May 31, 2022