What is the impact of Natural Ventilation on HVAC Electricity Consumption and Thermal Comfort?
Project Location:
Simulation Scale:
Application:
Audience:
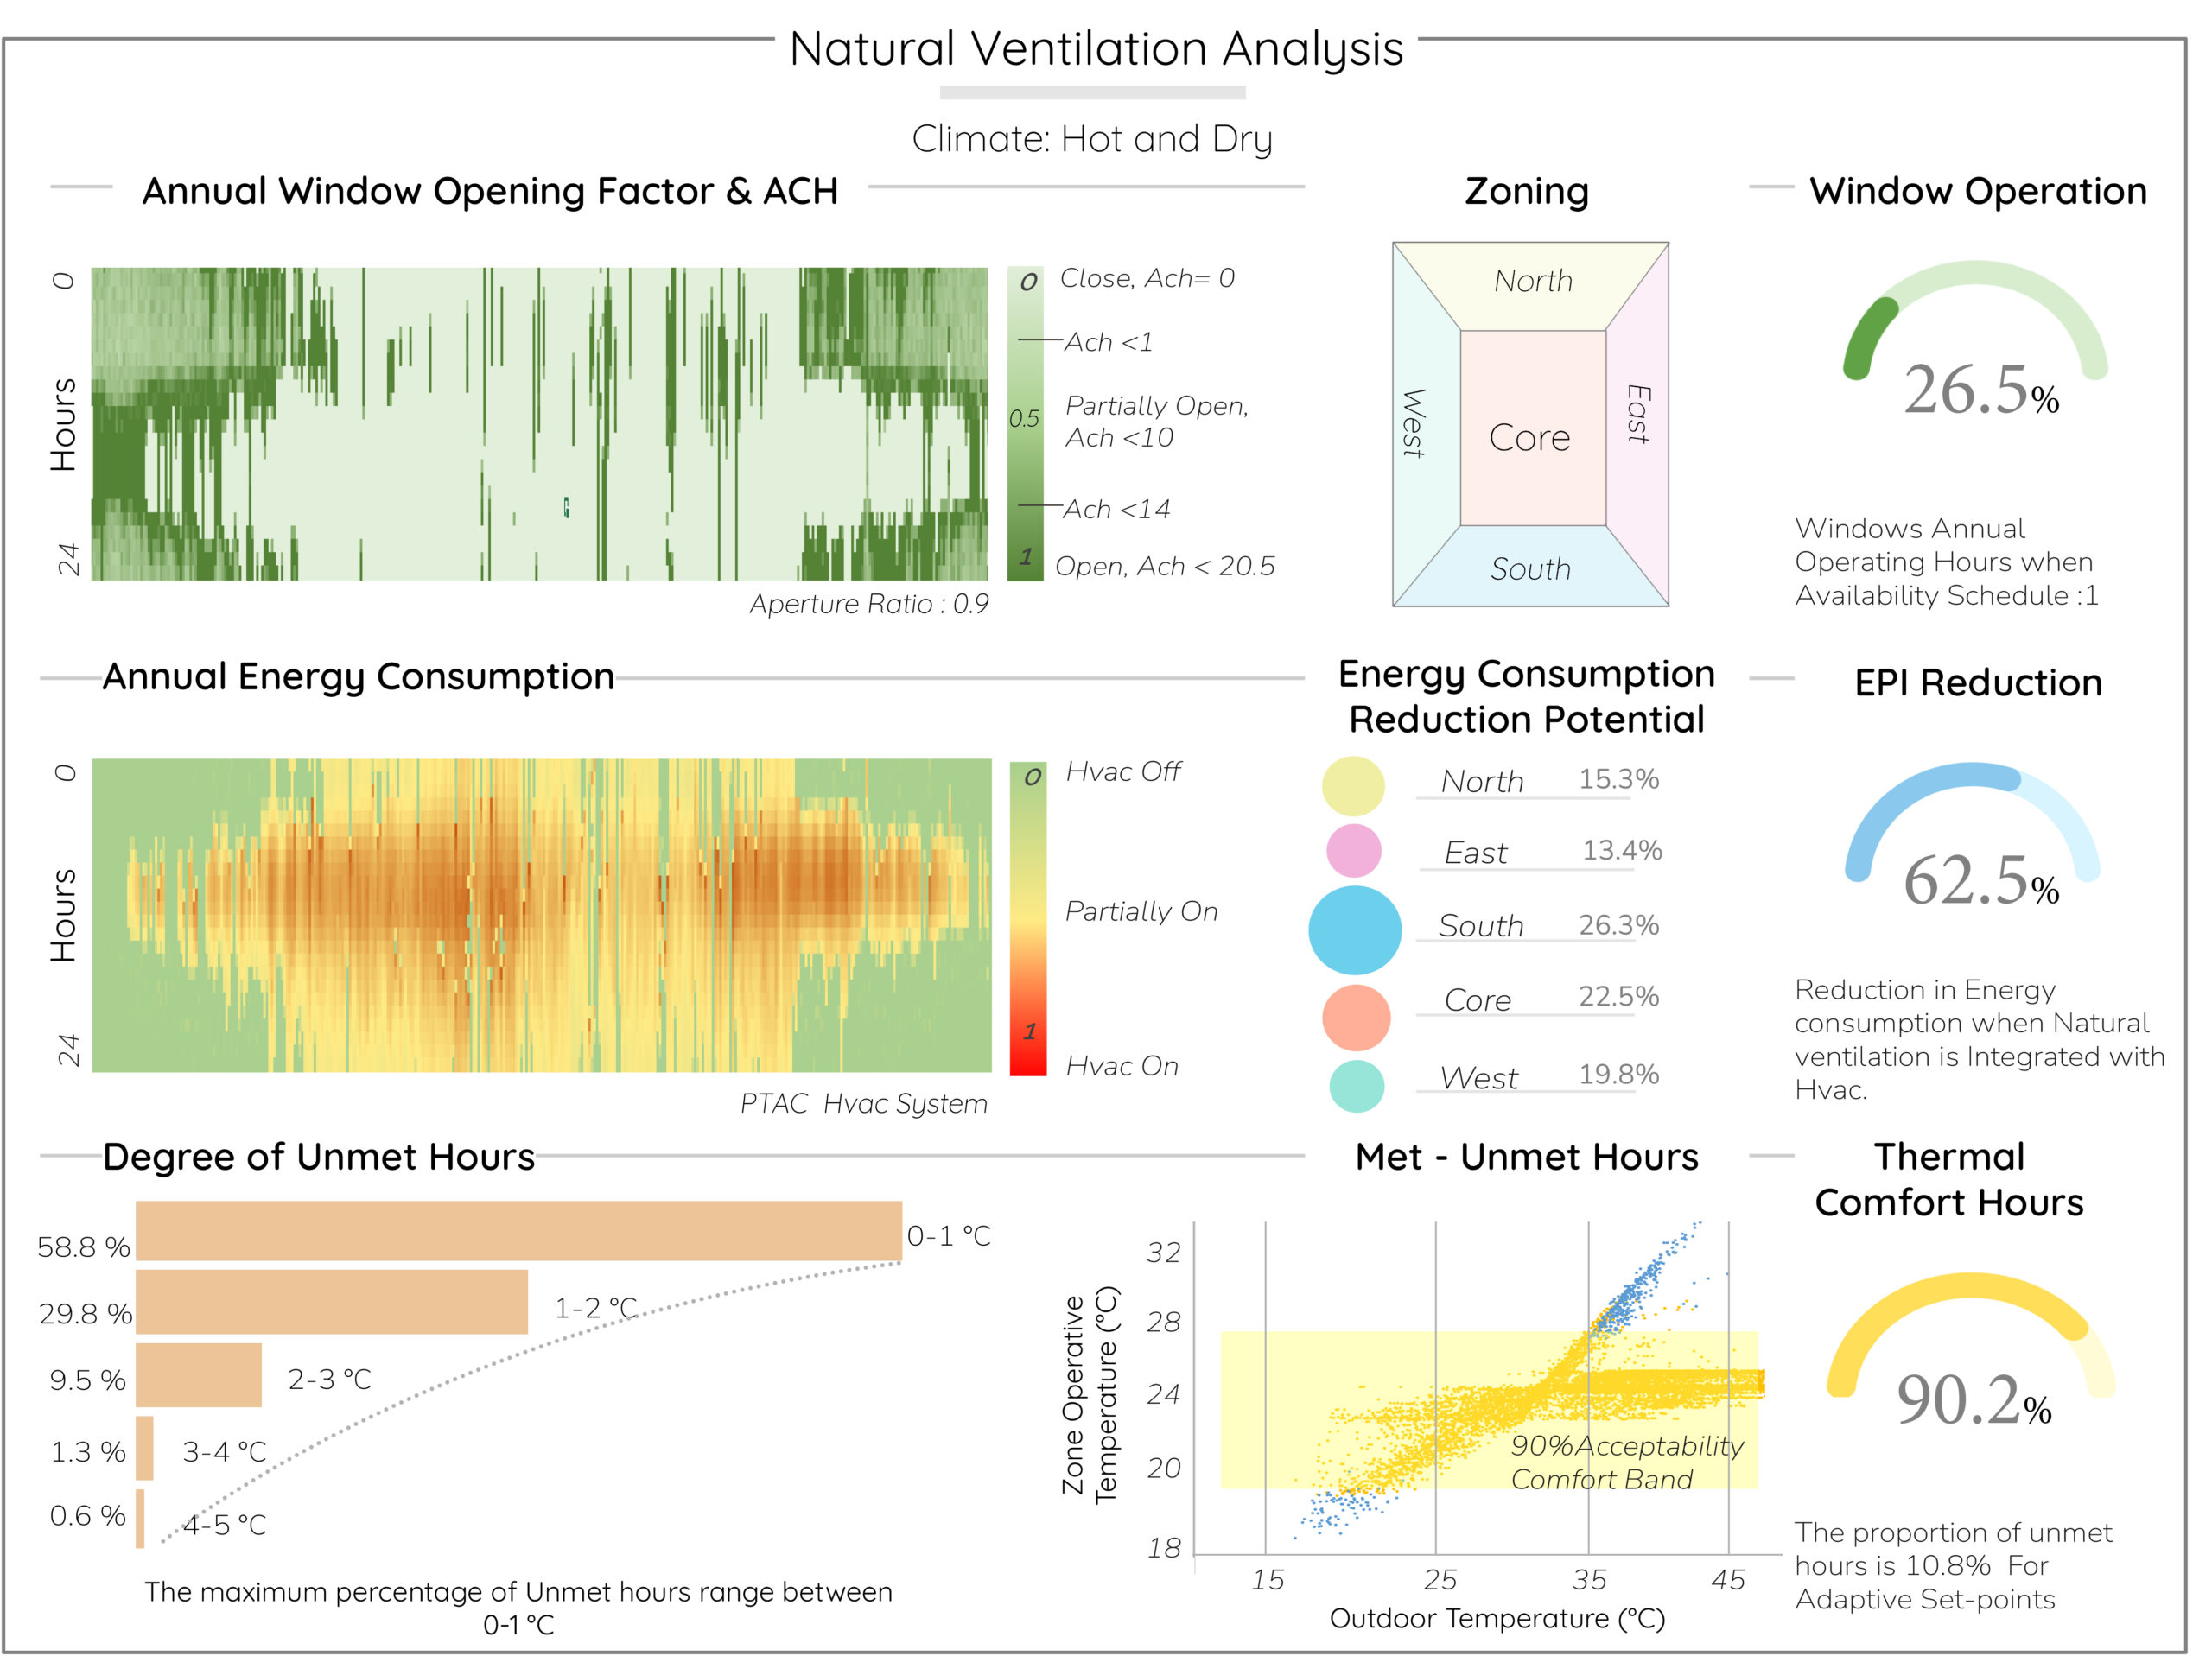
What is this graphic showing? Describe the different parts of the graphic and how it communicates the data.
This graphic attempts to portray the impact of integrating Natural Ventilation on the Annual HVAC Energy Usage and the Thermal Comfort of the occupants. It starts with portraying the Window Opening Factor and its impact on the ACH. In the model, we can observe the windows opening when • Tzone air > TSet point • Tzone air > Toutside air • Availability Schedule Value = 1 Window opening aids in removing the accumulated heat from the previous day and hence helps in maintaining the internal Set temperatures. The graphic then attempts to portray that for the given climate zone, this passive design strategy has significant impact on the HVAC System performance in the building and the occupant’s Thermal Comfort in the desired manner. The assessment was performed for the East Zone. As per the defined window operation control logic, the model adjusts the Window Opening Ratio (Effective Aperture Ratio Set at 0.9) to maintain the Zone air operative temperatures. Reduction in overall AC energy consumption is achieved by simulating and comparing a case with a fully air-conditioned space at a fixed static setpoint, and, a case having change-over mixed mode integrated with the natural ventilation and AC operation having weekly floating setpoint. This resulted in 62.5% energy savings. The India Model for Adaptive Comfort was referred to arrive at 90% acceptability thermal comfort bands.
What type of graphic is this?
- Case Study / Multiple
- Diagram
- Analysis grid
Design Variables
- Passive strategies
What tools were used for the simulation analysis?
- Design Builder
- EnergyPlus
- Excel
What tools did you use to create the graphic?
- Adobe Indesign
- Adobe Photoshop
- Excel
What was successful and/or unique about the graphic in how it communicates information?
This exploration was to understand the impact of the natural ventilation on the Thermal comfort of the occupants and the reduction in energy Usage of HVAC systems. The graphic assists the designer in comprehending these aspects while designing and enables them to make data driven design decisions during the early design stage.
Is there anything else you would like to mention?
This analysis was done as a part of classroom exercise under Master's in Building Energy Performance in Cept University, Ahmedabad under the Guidance of Professor Rajan Rawal.
Included in the competition:

What is the impact of Natural Ventilation on indoor comfort and energy use?
March 17, 2022-May 31, 2022