What is the impact of Plants on Indoor CO2 level?
Project Location: Zone 4C Mixed Marine
Simulation Scale: Shoebox Model
Application: Conceptual
Audience: Academic
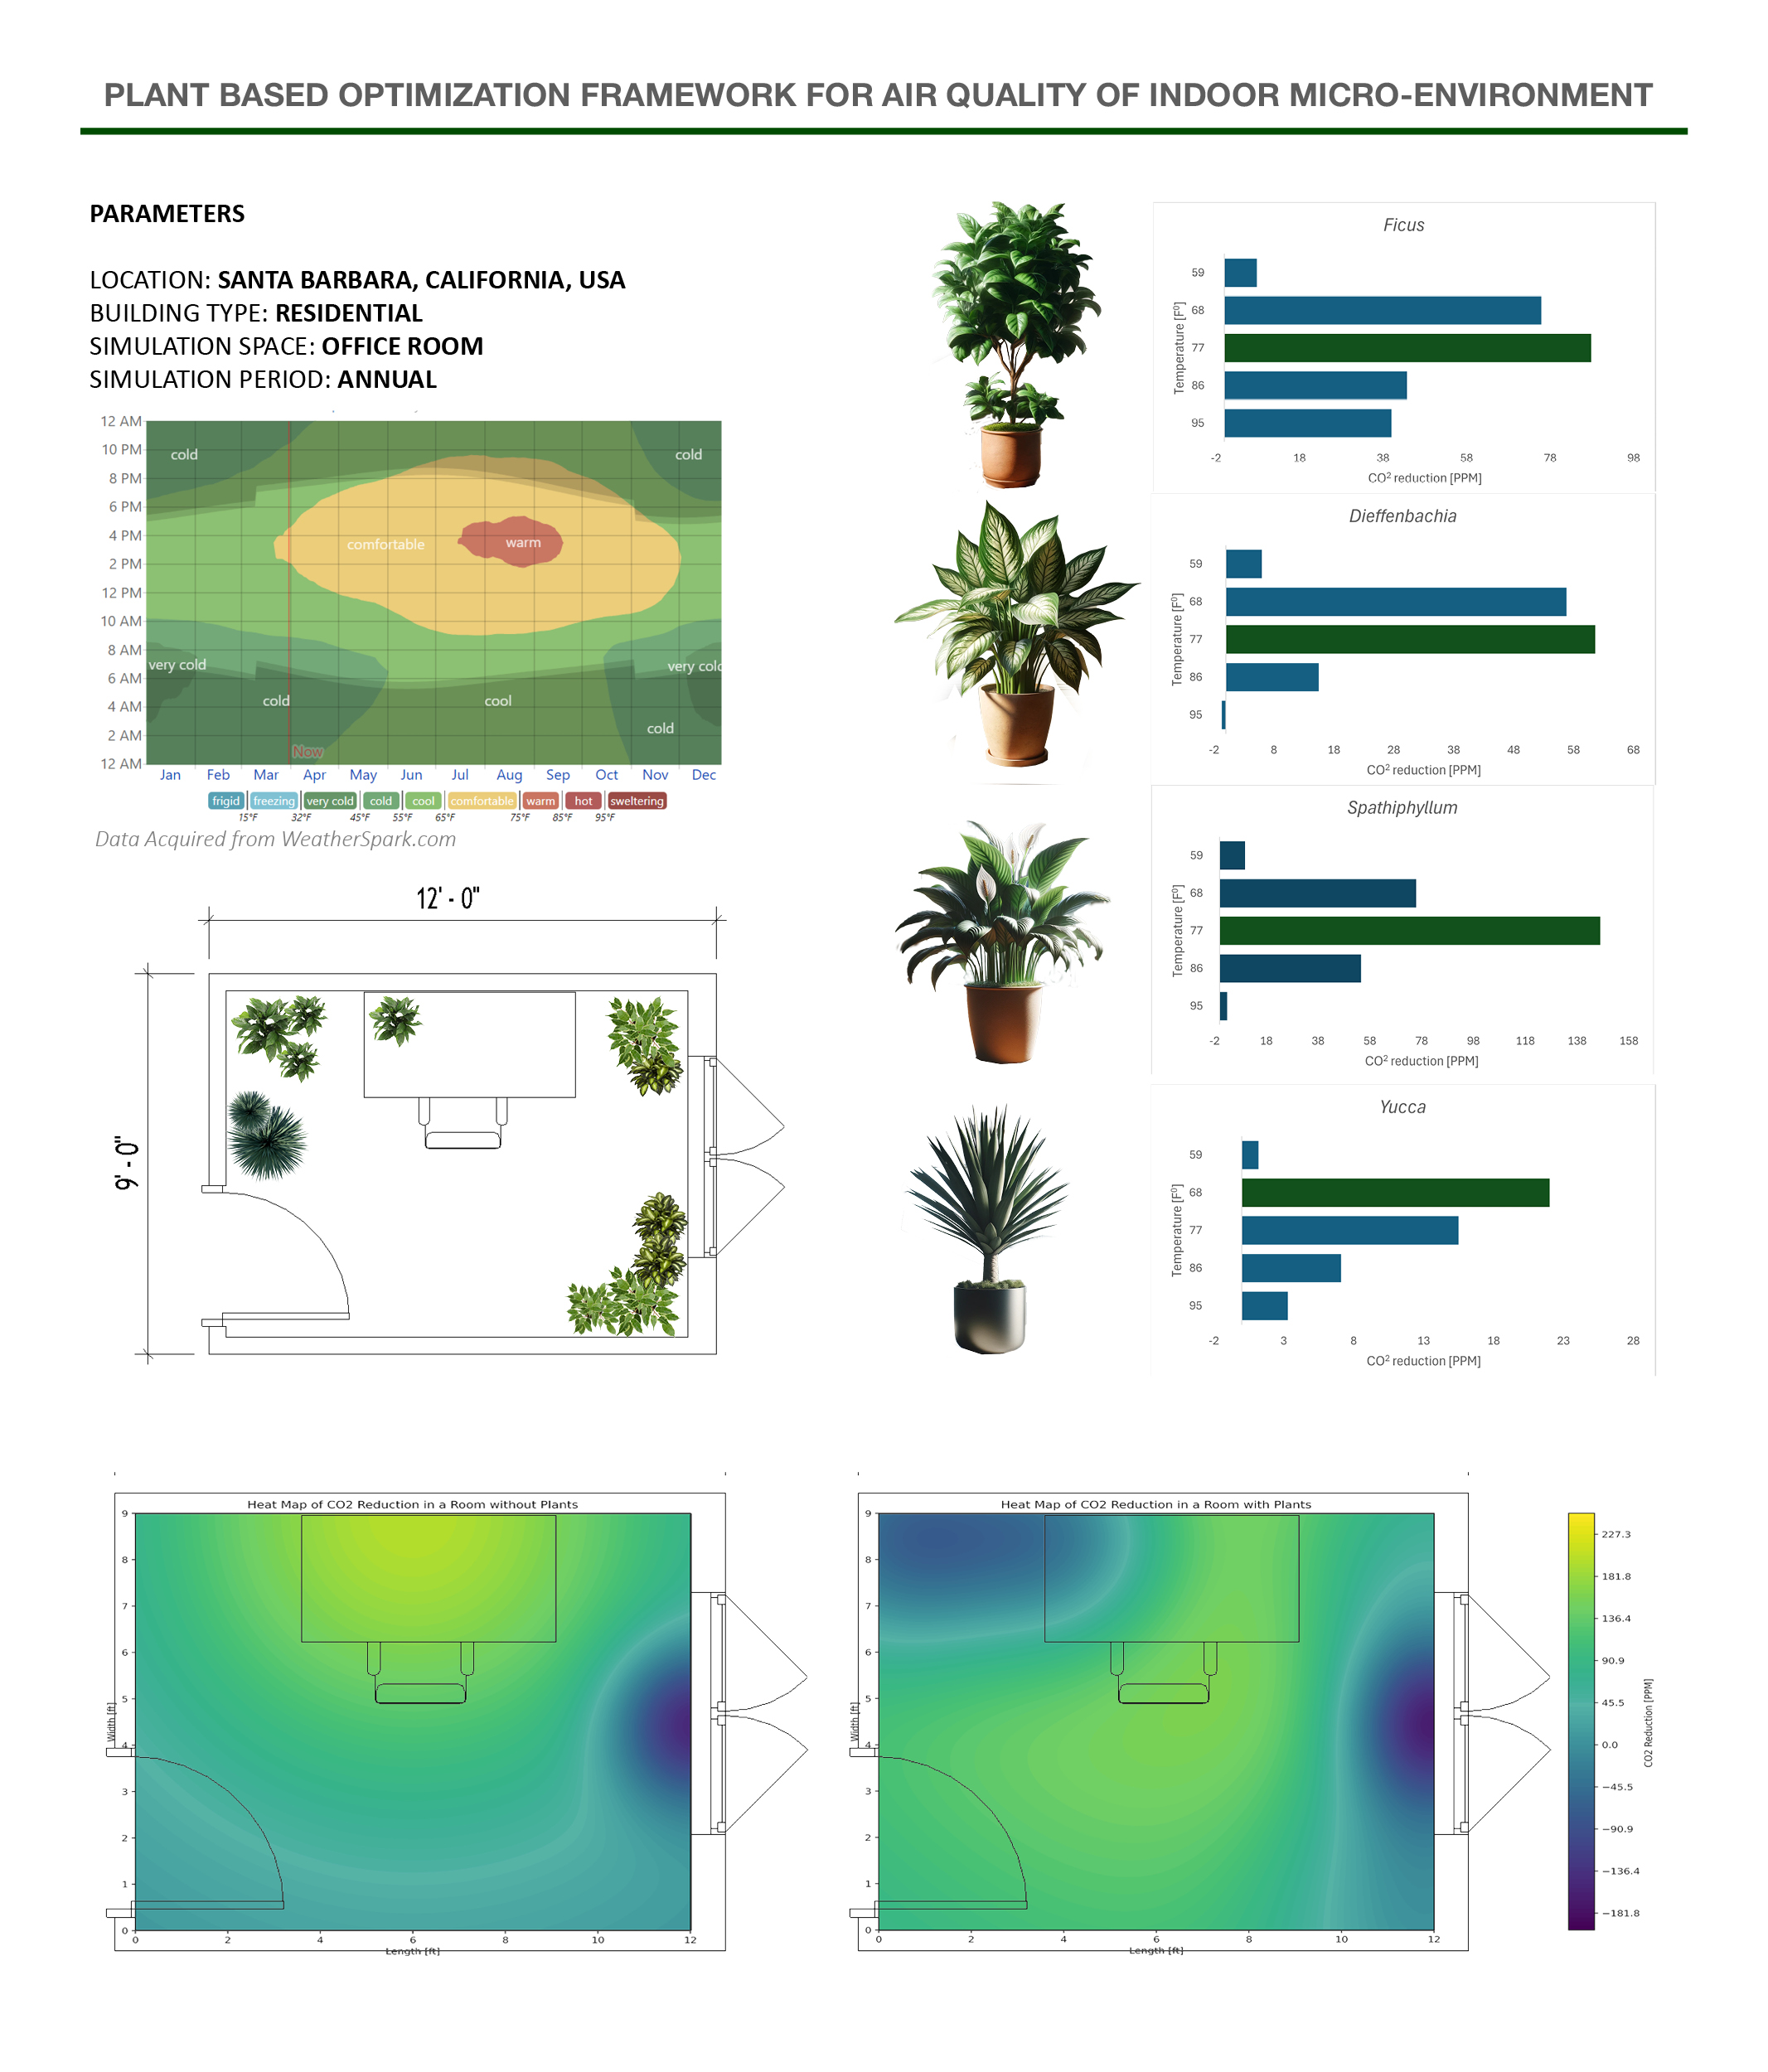
What is this graphic showing? Describe the different parts of the graphic and how it communicates the data.
The bar graph depicts the mean profile of carbon dioxide reduction, which simplifies a non-linear variation of carbon reduction. The heat map analysis represents the carbon dioxide level in an indoor room of a typical office. The value 0 on the legend corresponds to a typical CO2 level of 600 PPM. With the human presence after diffusion, with surrounding indoor air it could be typically 200 PM higher. Considering window being the source of ventilation it has a PPM of about 400 PPM which is close to outdoor CO2 levels. By strategically placing typical indoor plants namely Ficus, Dieffenbachia, Spathiphyllum and Yucca there is a significant reduction of CO2 levels which is seen in the heatmap.
What type of graphic is this?
- Case Study / Multiple
Design Variables
- Other
- Passive strategies
Is this part of the ASHRAE-209 cycle?
What tools were used for the simulation analysis?
- Other
What tools did you use to create the graphic?
- Adobe Indesign
- Adobe Photoshop
- Excel
- Grasshopper/Rhino
- Python
What was successful and/or unique about the graphic in how it communicates information?
The heat map analysis depicts the impact of Carbon Dioxide reduction by strategically placing typical indoor plants namely Ficus, Dieffenbachia, Spathiphyllum and Yucca. This is complemented by the bar graphs that project the mean carbon dioxide reduction over time in various temperature generally found indoors.
Is there anything else you would like to mention?