What is the impact of Simulation on Natural Ventilation Design?
Project Location:
Simulation Scale:
Application:
Audience:
What is this graphic showing? Describe the different parts of the graphic and how it communicates the data.
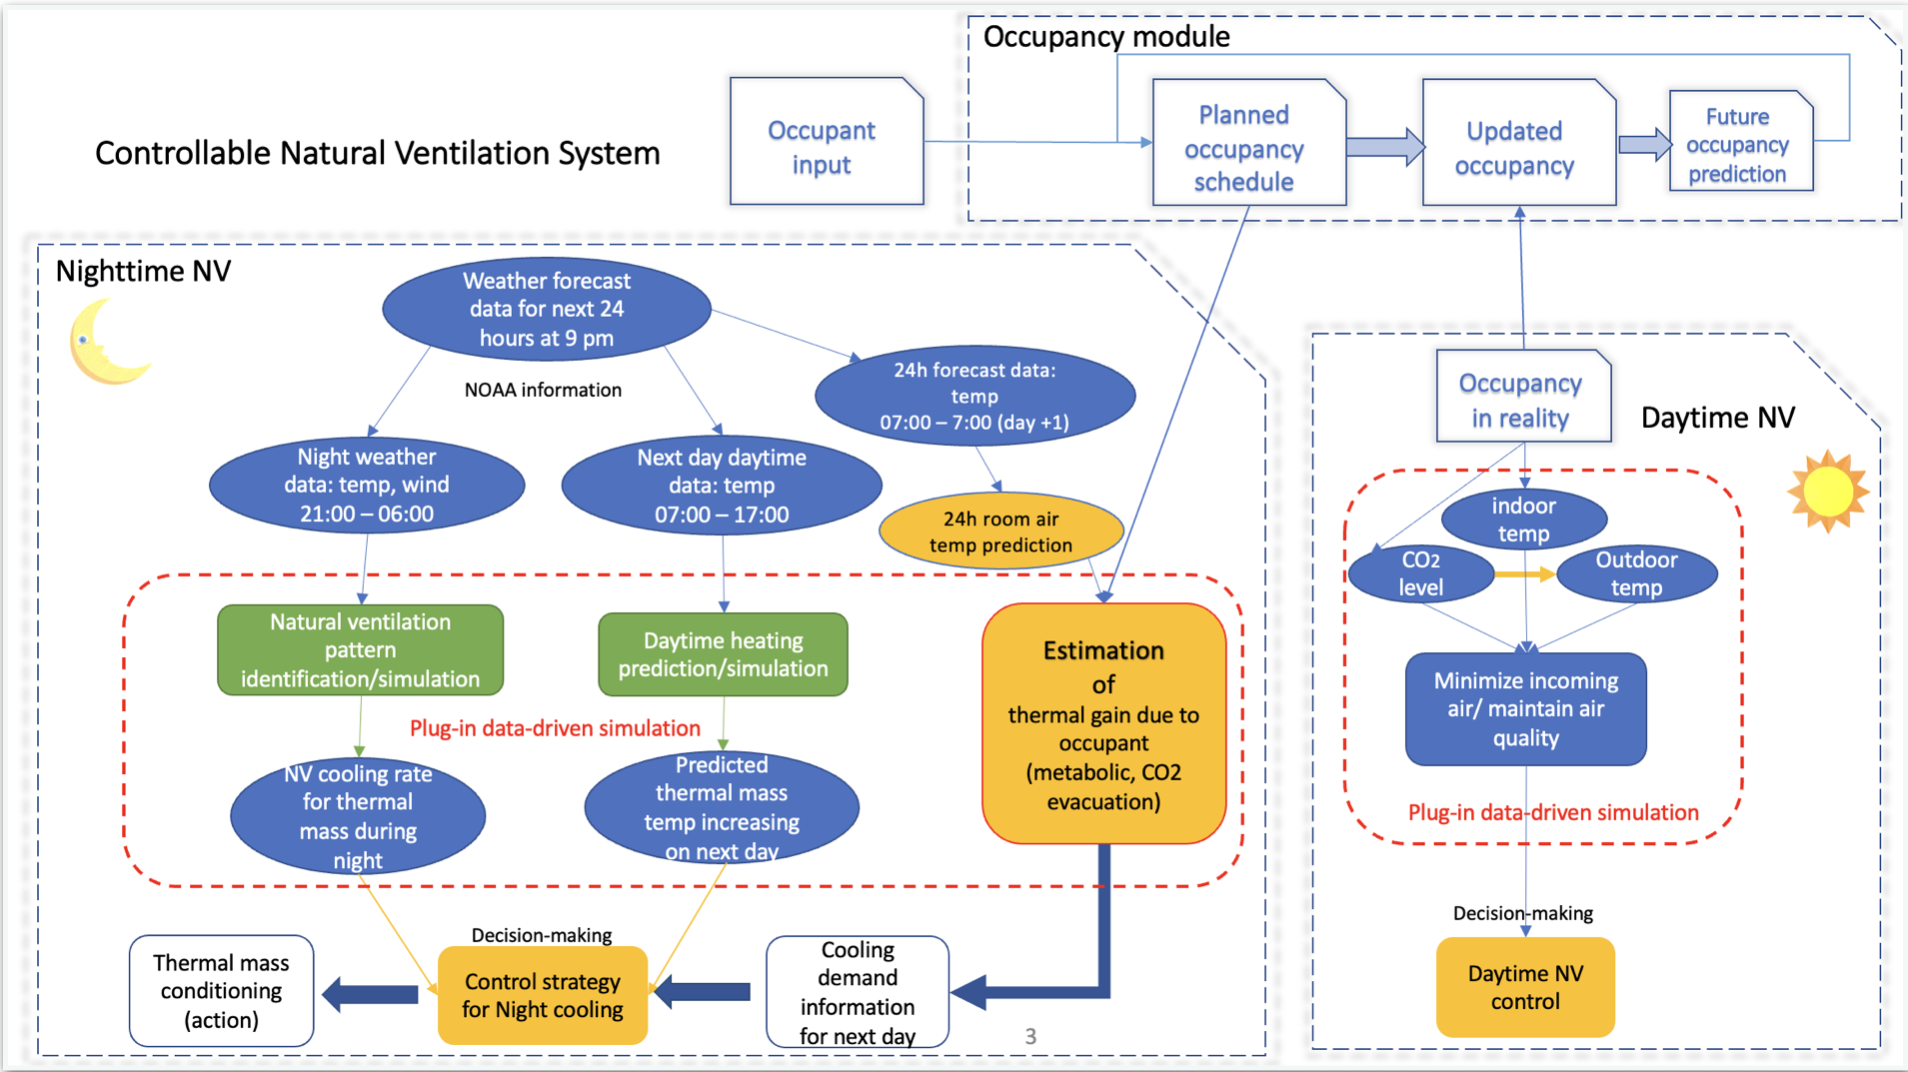
In this case study, the natural ventilation has been studied in two major scenarios: 1) daytime natural ventilation, which regulates the indoor air quality and thermal comfort for occupants, 2) nighttime natural ventilation, which regulates the internal thermal mass temperature during night, while predicting the thermal condition of the next day for the building. In daytime natural ventilation, the plug-in data-driven simulation is the evolution of temperature/CO2 with the window operation. The window position is simulated with measured temperature, wind direction, wind speed, room CO2 level. Based on the criterion of room air quality and thermal comfort, an optimal window position is selected and sent to the window position controller. In nighttime natural ventilation, the plug-in data-driven simulation includes the thermal behavior prediction based on weather forecast information. When the sunset, the next 24 hours weather information is retrieved through a specified program, and divided into two parts: 1) the nighttime dataset, which includes wind data, outdoor temperature data; and 2) the next daytime dataset, which includes the wind data, outdoor temperature data, solar radiation, and cloud cover data. The plug-in data-driven simulation has two separated functions: 1) simulate the building cooling rate with nighttime dataset and possible window positions, and 2) simulate the building thermal mass temperature increment with next daytime dataset and possible window position. In each function, an optimal window position is selected and sent to window position controller.
What type of graphic is this?
- Case Study / Multiple
Design Variables
- Passive strategies
What tools were used for the simulation analysis?
- Other
What tools did you use to create the graphic?
- Other
- Python
What was successful and/or unique about the graphic in how it communicates information?
The primary takeaway of this case study is to demonstrate the natural ventilation system in buildings could be controllable with quantitative objectives. This case study is also to reveal that a holistic analysis could contribute to a design of natural ventilated building.
Is there anything else you would like to mention?
This case study is based on PhD dissertation: Wei Zhang, 2021. 'Data-driven Predictive Control Optimization for Natural Ventilation in Buildings', Harvard University
Supplementary Graphics
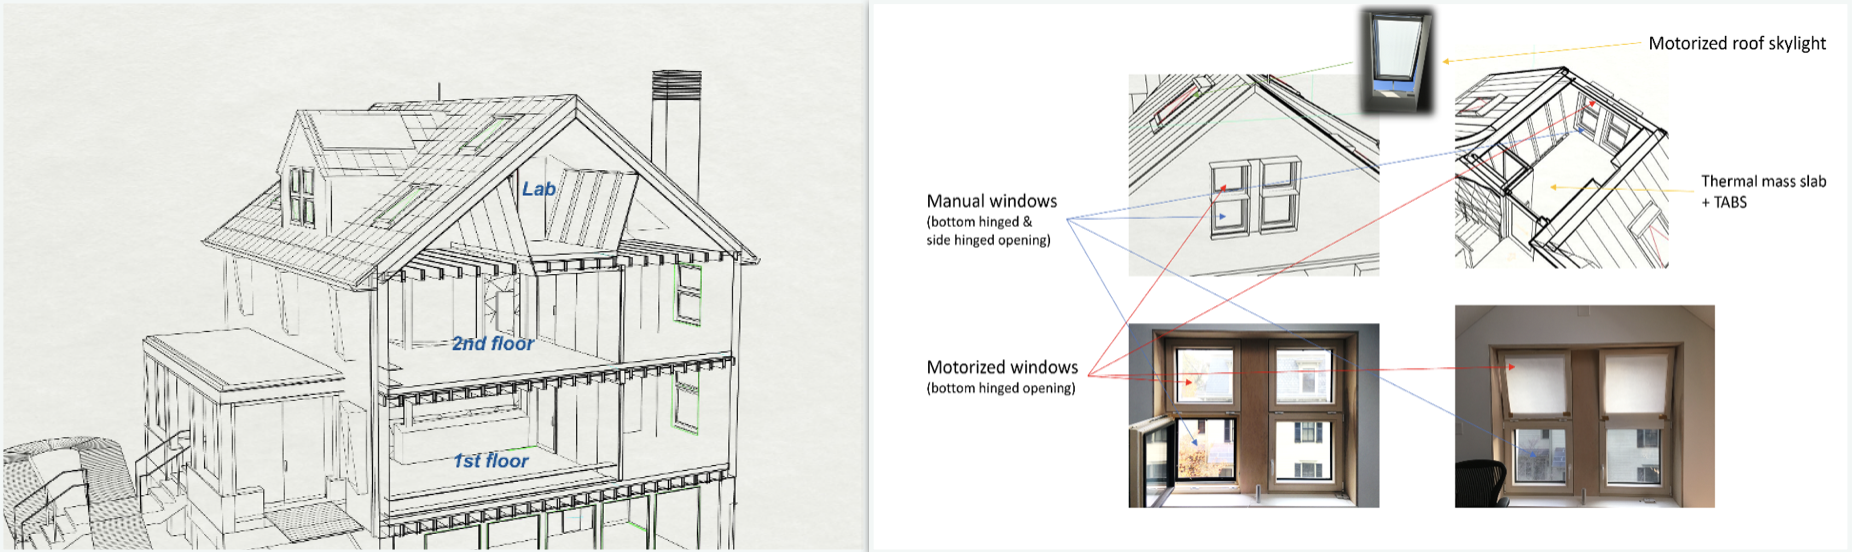
Building, Lab and operable windows
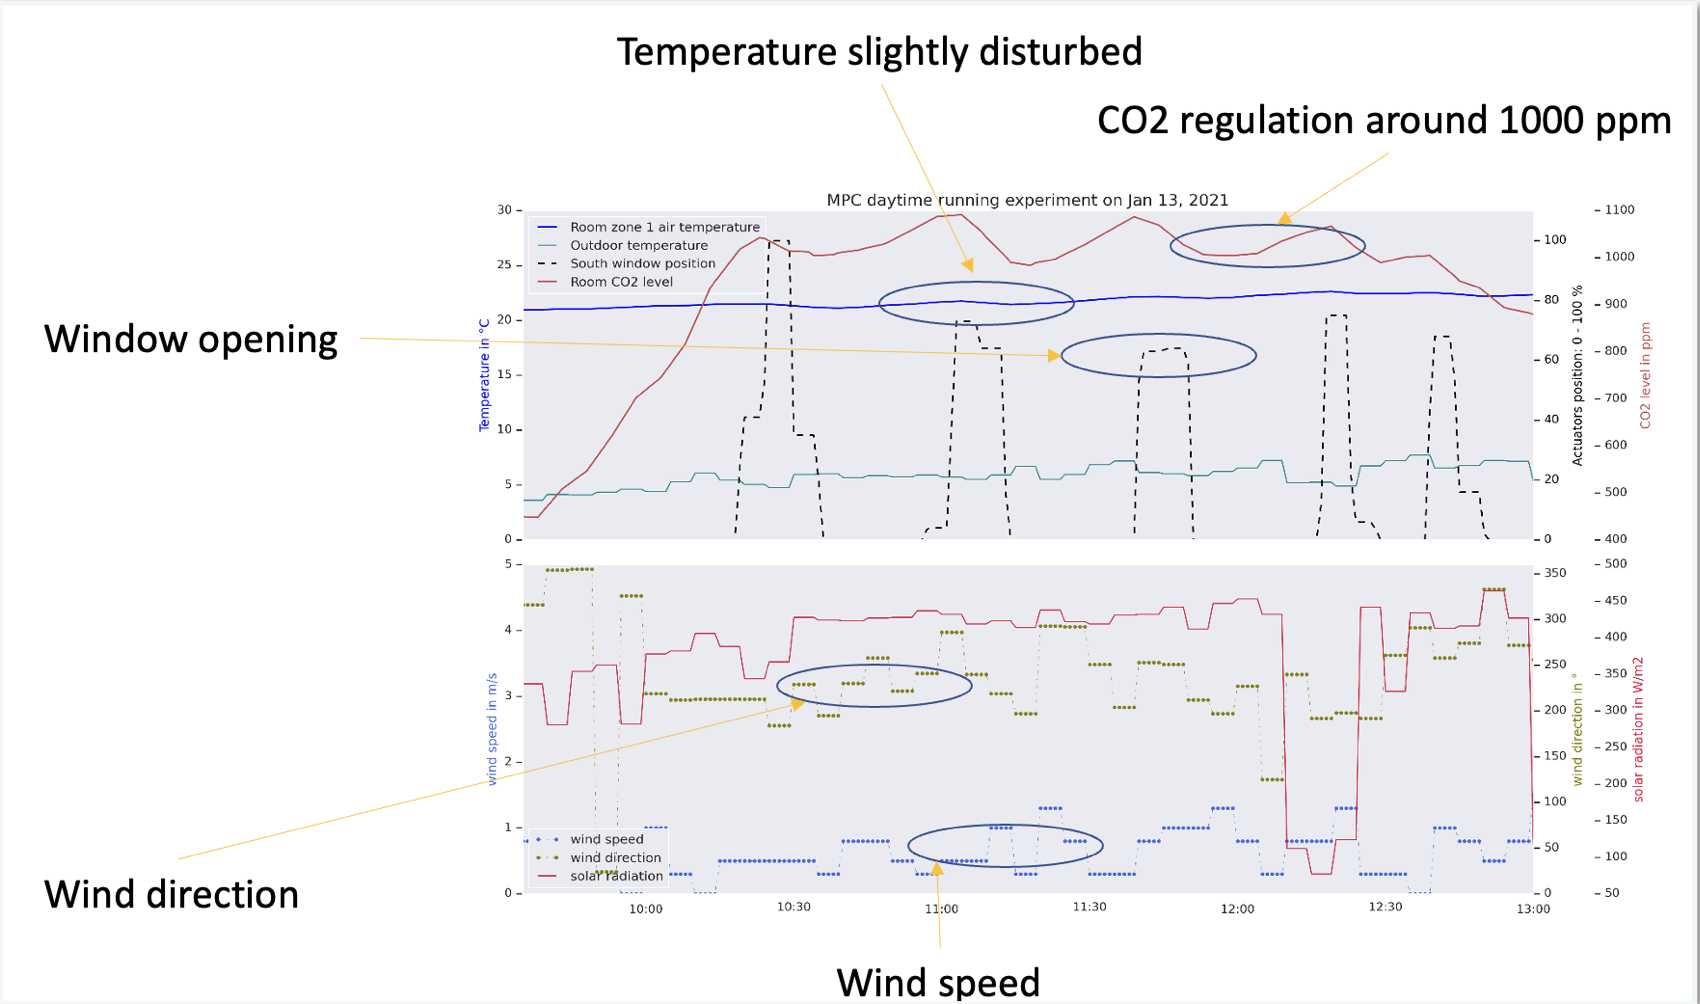
Daytime natural ventilation CNVS evaluation in winter
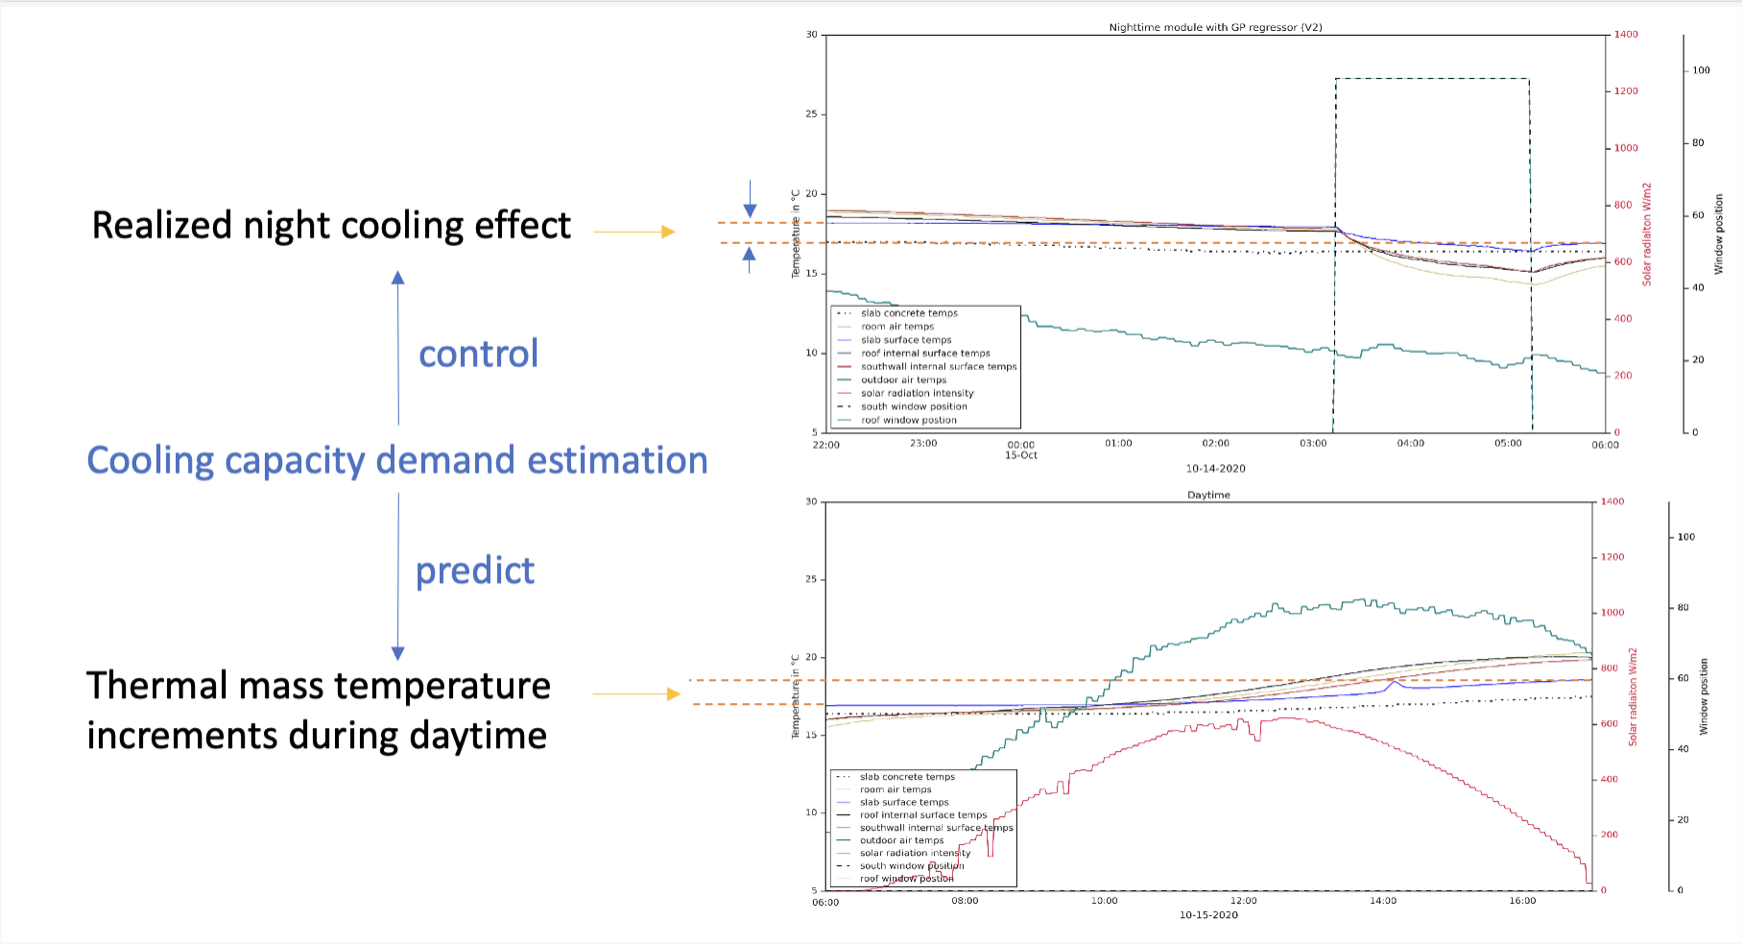
Nighttime natural ventilation CNVS evaluation
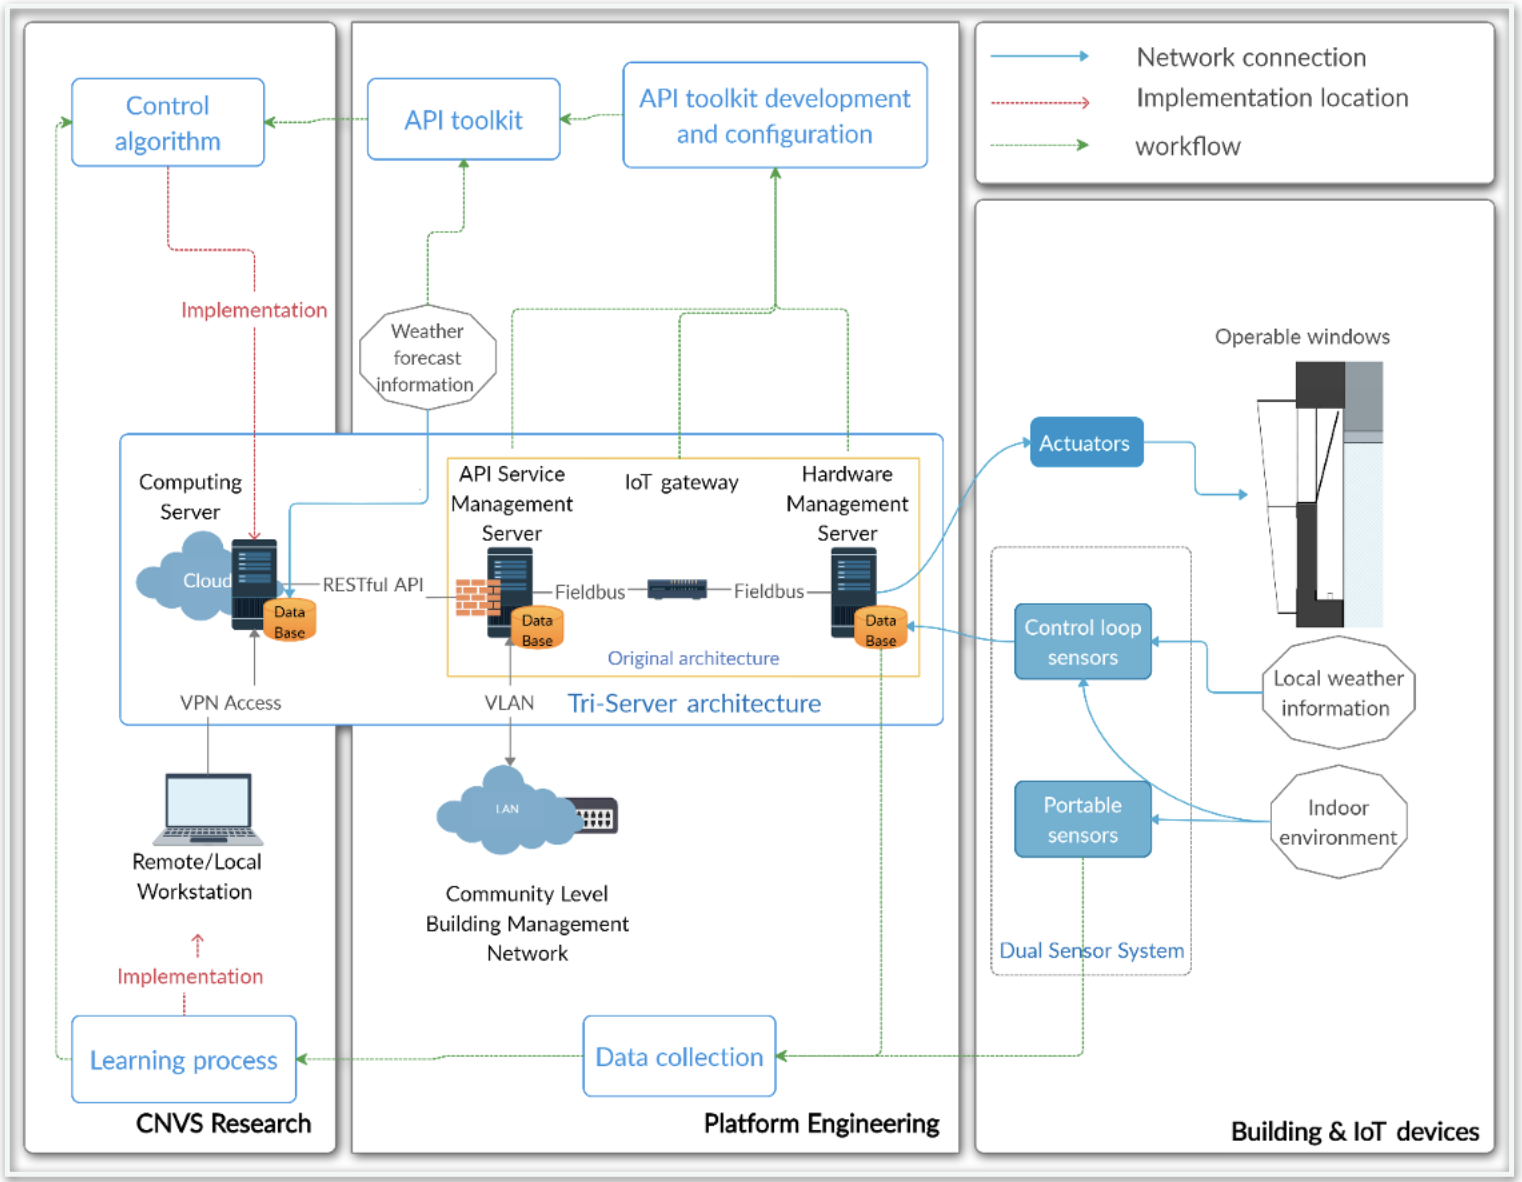
Architecture in Architecture: the information system to support the smart naturally ventilated building
Additional credits and other contributors:
The natural ventilation pattern in a building required the involvement of advanced data science and control theory knowledge: the former is responsible for the retrieve of natural ventilation pattern, the latter augments the simulation of natural ventilation pattern with a control-oriented interface. The building physics and meteorology knowledge serve as a reference of this plug-in data-driven simulation. The links among these disciplines are realized through a novel framework, including computational platform and a machine learning based workflow, as shown in Figure "Architecture in Architecture". This framework ensures the sensor measurement, data storage, learning process, control deployment, building performance evaluation and algorithmic self-updating. Besides these building level functions, the framework is also scalable for more natural ventilated buildings as a building management system.Included in the competition:
What is the impact of Natural Ventilation on indoor comfort and energy use?
March 17, 2022-May 31, 2022