What is the impact of wind and humidity on outdoor comfort?
Project Location:
Simulation Scale:
Application:
Audience:
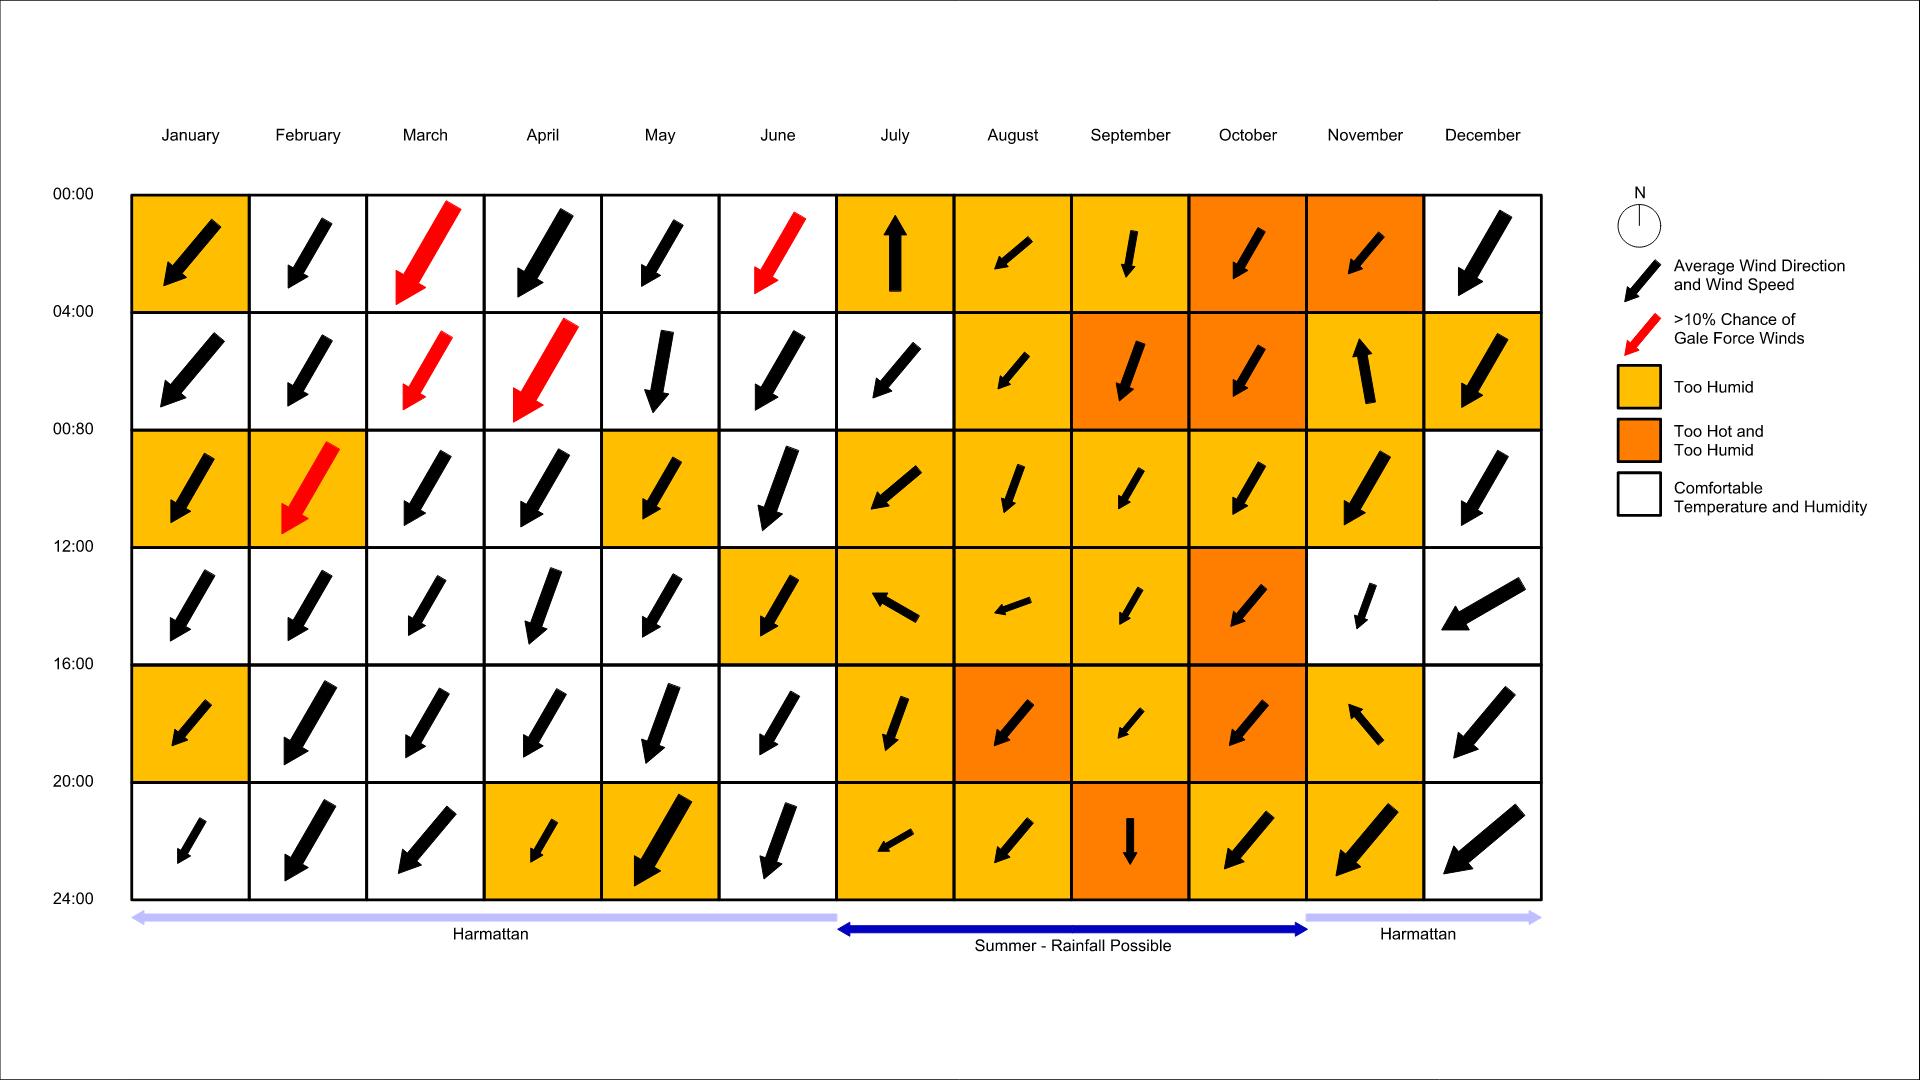
What is this graphic showing? Describe the different parts of the graphic and how it communicates the data.
This diagram plots wind direction, wind speed, and humidity by month and time of day to provide an illustration of outdoor comfort. The data reveals that weather patterns for this region can be categorized in two seasons: Summer and Harmattan. Note that this analysis was done for a warm climate island location.
What type of graphic is this?
- Table / Chart
Design Variables
- Other
- Passive strategies
What tools were used for the simulation analysis?
- Excel
What tools did you use to create the graphic?
- Adobe Illustrator
- Excel
- Grasshopper/Rhino
What was successful and/or unique about the graphic in how it communicates information?
The team created this diagram as an alternative to wind rose diagrams. Wind roses may graphically overstate the effect of wind from a single orientation, when in reality, wind patterns are more dispersed. This diagram also helped the team realize that the common notion of seasonality (Spring, Summer, Fall, Winter) does not apply to all regions and cultures.
Is there anything else you would like to mention?
Graphic design inspired by Design With Climate, by Victor Olgyay.
Additional credits and other contributors:
Studio Ma: Bobby CannavinoThornton Tomasetti: Alejandra Menchaca, Jacqueline Lu, and Nicole Peterson.