What is the impact of Window Performance on EUI?
Project Location:
Simulation Scale:
Application:
Audience:
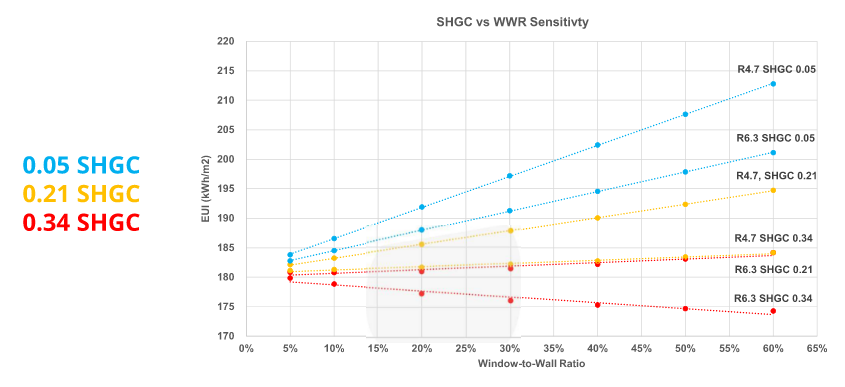
What is this graphic showing? Describe the different parts of the graphic and how it communicates the data.
For a MURB building in cold climate zone 7, it's evident that at some SHGC and Window R-value, it's more beneficial to have additional glazing than having less glazing.
What was successful and/or unique about the graphic in how it communicates information?
The counter-intuitive idea that more of something bad (glazing) can actually be good (less EUI)
Is there anything else you would like to mention?