What is the impact of WWR on EUI?
Project Location:
Simulation Scale:
Application:
Audience:
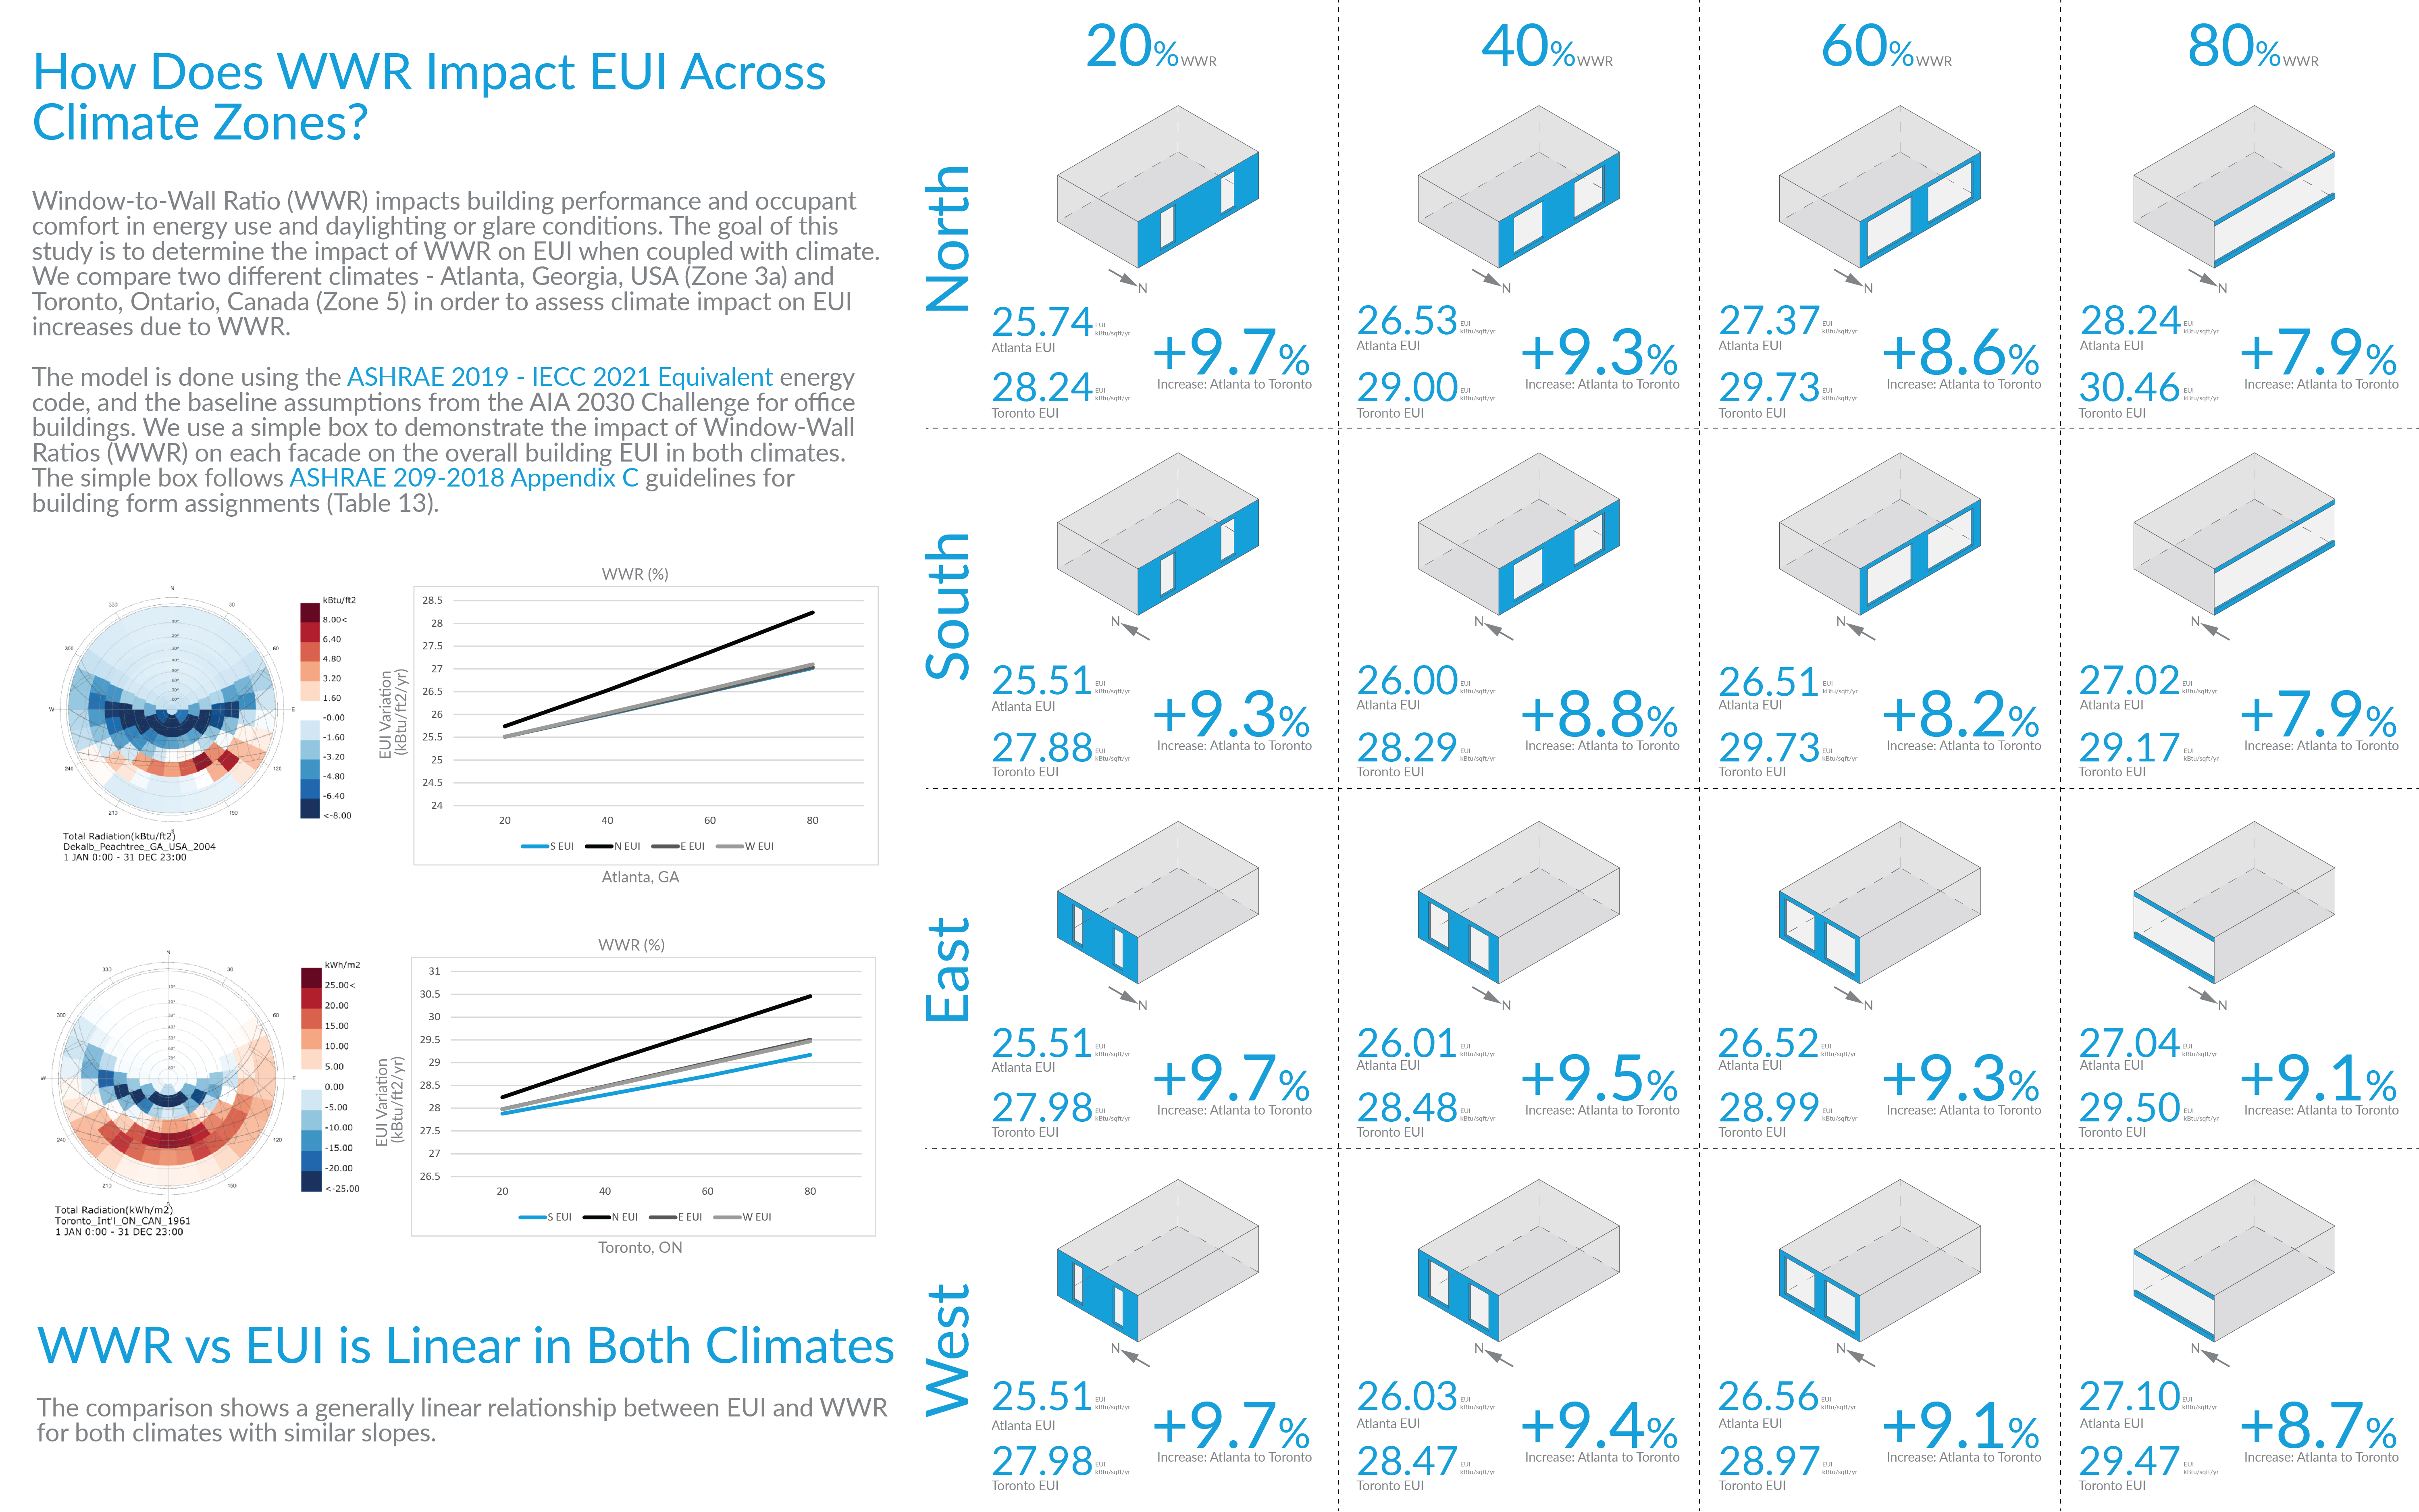
What is this graphic showing? Describe the different parts of the graphic and how it communicates the data.
This graphic demonstrates the relationship between WWR and EUI across two distinct climate zones via direct comparison and percentage differences. It shows a linear relationship between the EUI and WWR with similar slopes for both climates, implying that the impact of changing the WWR is roughly similar for both Atlanta, GA, USA and Toronto, ON, Canada.
What type of graphic is this?
- Diagram
Design Variables
- Glazing Fraction/Window to Wall ratio
Is this part of the ASHRAE-209 cycle?
- Cycle 1 Simple Box Model
What tools were used for the simulation analysis?
- Cove.tool
What tools did you use to create the graphic?
- Adobe Illustrator
- Excel
What was successful and/or unique about the graphic in how it communicates information?
The graphic uses direct numerical relationships alongside the charted comparison to demonstrate similarity between two distinct datasets.
Is there anything else you would like to mention?
We expected to find a larger impact from WWR when we began simulations. However, the result that WWR had a fairly consistent impact on EUI across the two climate zones is equally as interesting. An additional study in a third climate, warmer than Atlanta, GA would be a useful future data point to compare.
Additional credits and other contributors:
Mostafa TahmasebiIncluded in the competition:

Simple Box Modeling - see sample question below. You are encouraged to come up with your own
November 16, 2021-January 29, 2022