PROJECT INFORMATION
Olivier Brouard
- Adobe Illustrator
temp
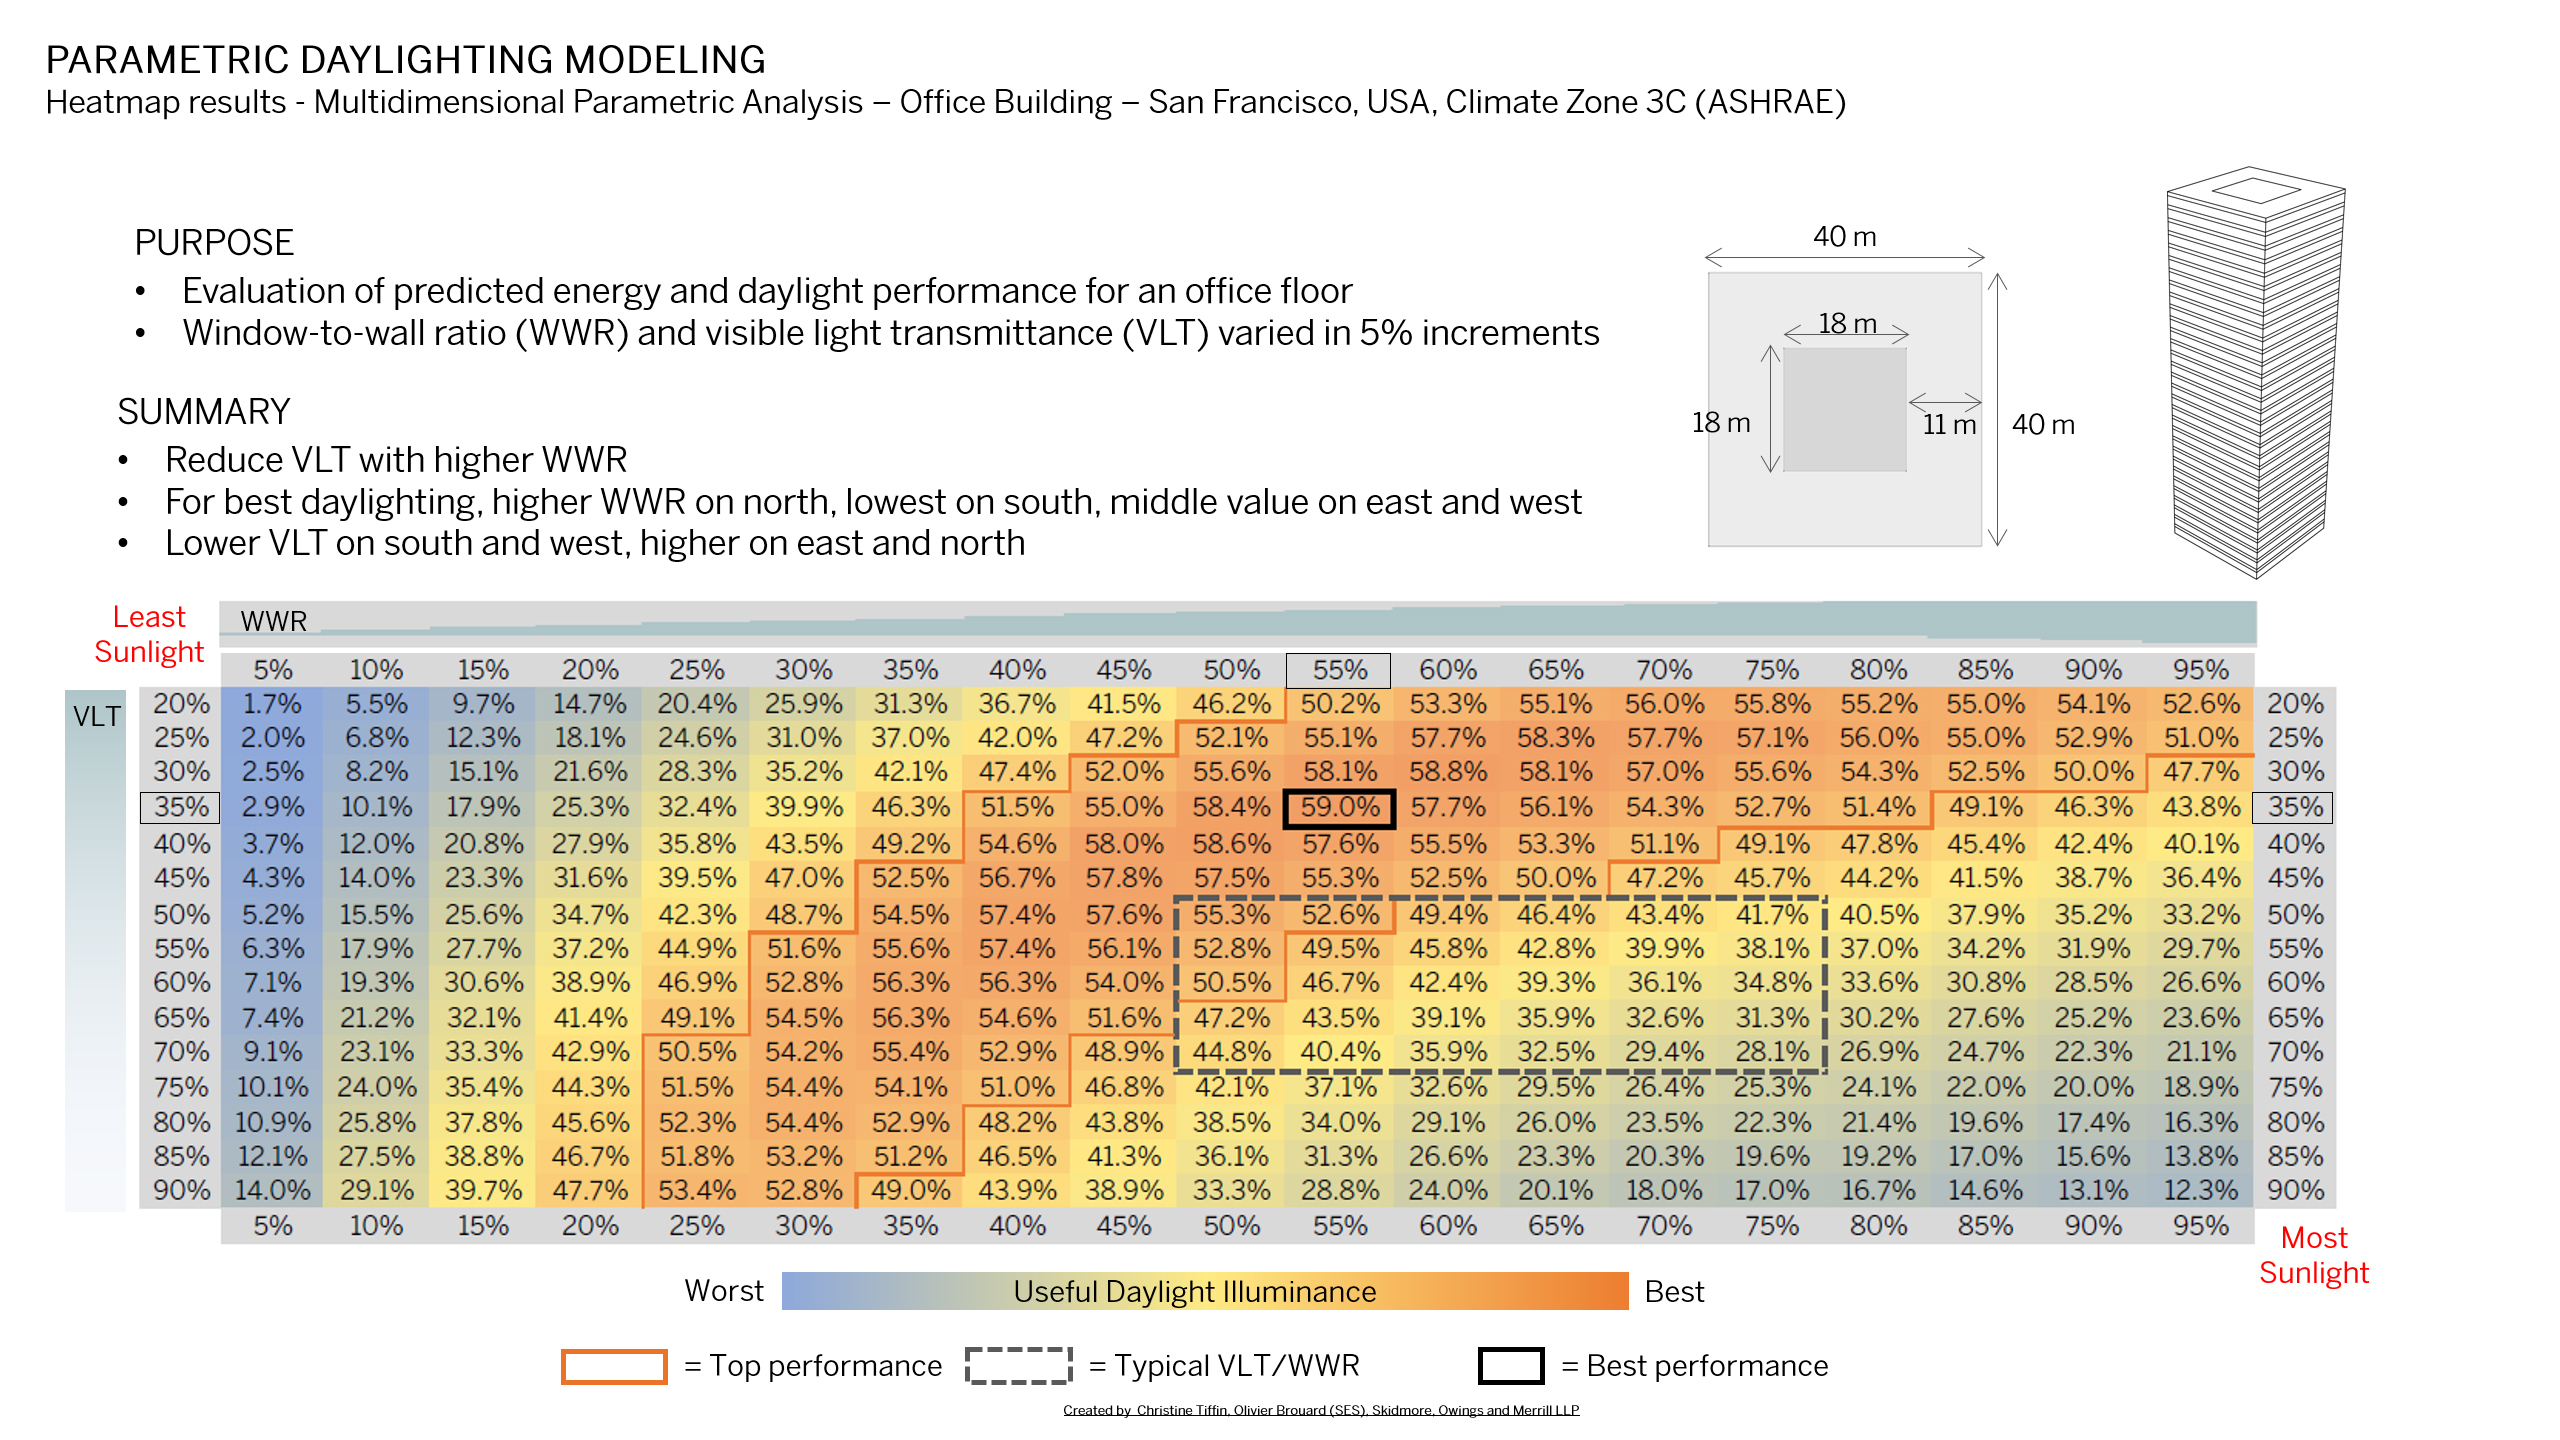
Window-to-wall ratio, Visual Light Transmittance
Graphic Information
The graphic shows a heat map of 285 simulations computed using grasshopper parametric script and DIVA with radiance as a back engine. The vertical axis represents the Visual Light Transmittance of the glass and the horizontal axis the variation of window-to-wall ratio. The % represent the UDI of the office space, seeking to find the sweet point between zones with too high illuminance level over 2000 lux and those below an underlit threshold of 200 lux.
The graphic is a conditional formatting rule using a color scale from low to high to represent visually the range of values computed from the output of the simulation.
The production of this graphic was initiated through various internal design team conversation seeking for optimal daylighting penetration.
This graphic is reference as a back end to dimension an office space with an acceptable depth and optimized window to wall ratio and visual light transmittance glazing selection
A single simple output color-coded showing 285 simulations showing the sweet spot range to reach.
More locations could have been run showing how the latitude and longitude could impact daylighting penetration.
This is a team effort of 2 people: - Christine Tiffin, Sustainability Dayglithing Specialist - Olivier Brouard, Sustainability Engineering Team Leader