PROJECT INFORMATION
CHEOL-SOO PARK
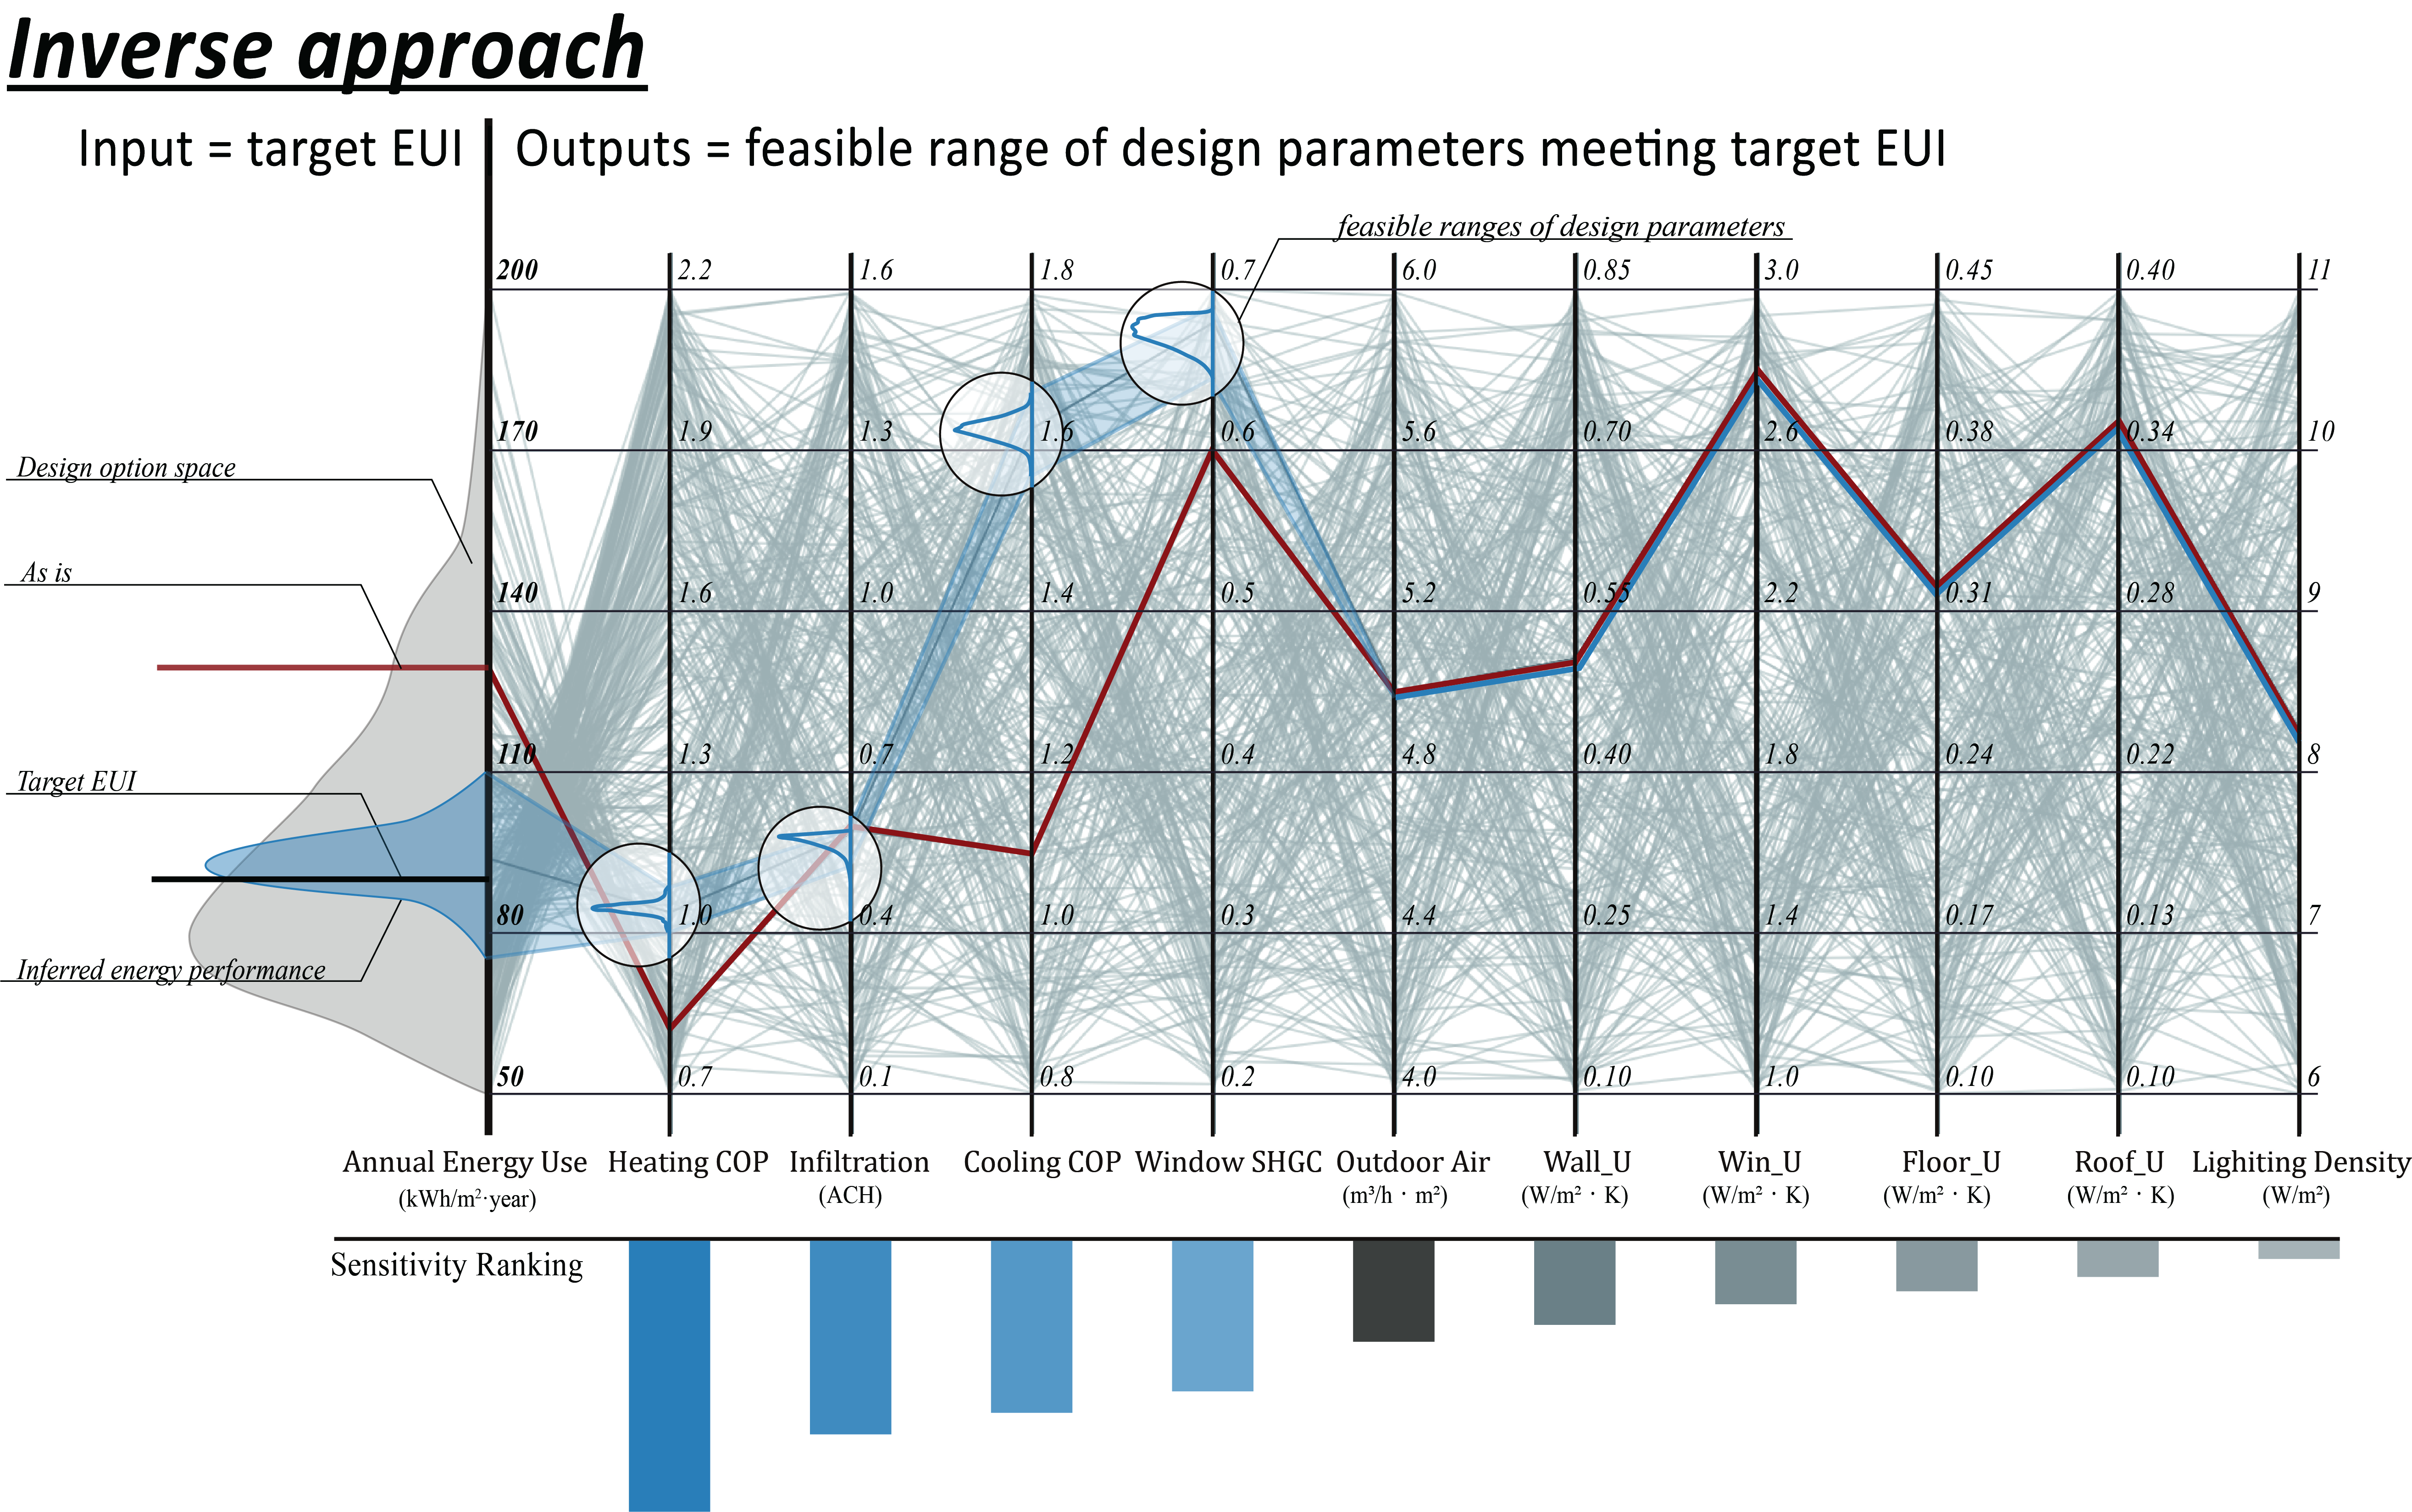
Parallel Coordinates
Energy model, weather data, measured monthly energy use
Graphic Information
We visualized the results using an ‘inverse’ parallel coordinates chart. Please note that the conventional parallel coordinates chart starts from design parameters (from left) to EUI (to right), while our ‘inverse’ parallel coordinates chart starts from the target EUI to feasible ranges of design parameters. It also includes sensitivity ranking of design parameters and inferred energy performance of the existing building after energy retrofit. When building stakeholders change target EUI on the left, they can see how the input (target EUI) influences feasible ranges of design parameters (output).
The process is as follows: 1) Developed an energy model of the existing building using DesignBuilder. 2) Conducted one of the Monte Carlo samplings, Latin Hypercube Sampling using MATLAB. The number of simulation samples was 1,000. 3) Because Bayesian calibration demands significant simulation running time, a reduced-order surrogate model, Artificial Neural network (ANN) Model, was constructed based on 1,000 simulation samples generated at Step 2. The ANN model was made using Keras, the Python deep learning library. 4) Ten uncertain parameters were estimated using Bayesian calibration using PyMC3, a Python package for Bayesian statistical modeling. 5) The Sobol method, one of the global sensitivity analysis methods, was conducted to identify significant design parameters. The Sobol is suitable for complex nonlinear models and can consider interactions effects. The Sobol analysis was conducted using SALib, an open-source sensitivity analysis library written in Python. After the Sobol analysis, four significant design parameters were identified including heating COP, cooling COP, window SHGC, and infiltration. 6) Bayesian inference, an inverse uncertainty analysis method, was conducted to obtain plausible ranges of four design parameters which could meet the target EUI (less than 90 kwh/m2/yr) and 30% energy savings target. 7) The ‘inverse’ parallel coordinates chart was made using Adobe tools.
In the current conventional forward approach where design parameters are input and EUI is output, designers have to iteratively evaluate their possible design choices until the design target is met. In the inverse approach presented in this graphic, target EUI is input and feasible ranges of design parameters are output. This inverse approach can enable designers to rapidly infer design parameters from the design option space.
The inverse approach could be beneficially utilized for the building stakeholder’s performance dialogue and rational decision making.
The concept of the ‘inverse’ parallel coordinates chart is unique/successful.
We would have performed a ‘multi-objective’ inverse approach.
N/A
https://www.youtube.com/watch?v=AhXZXrlRbaU