PROJECT INFORMATION
Olivier Brouard
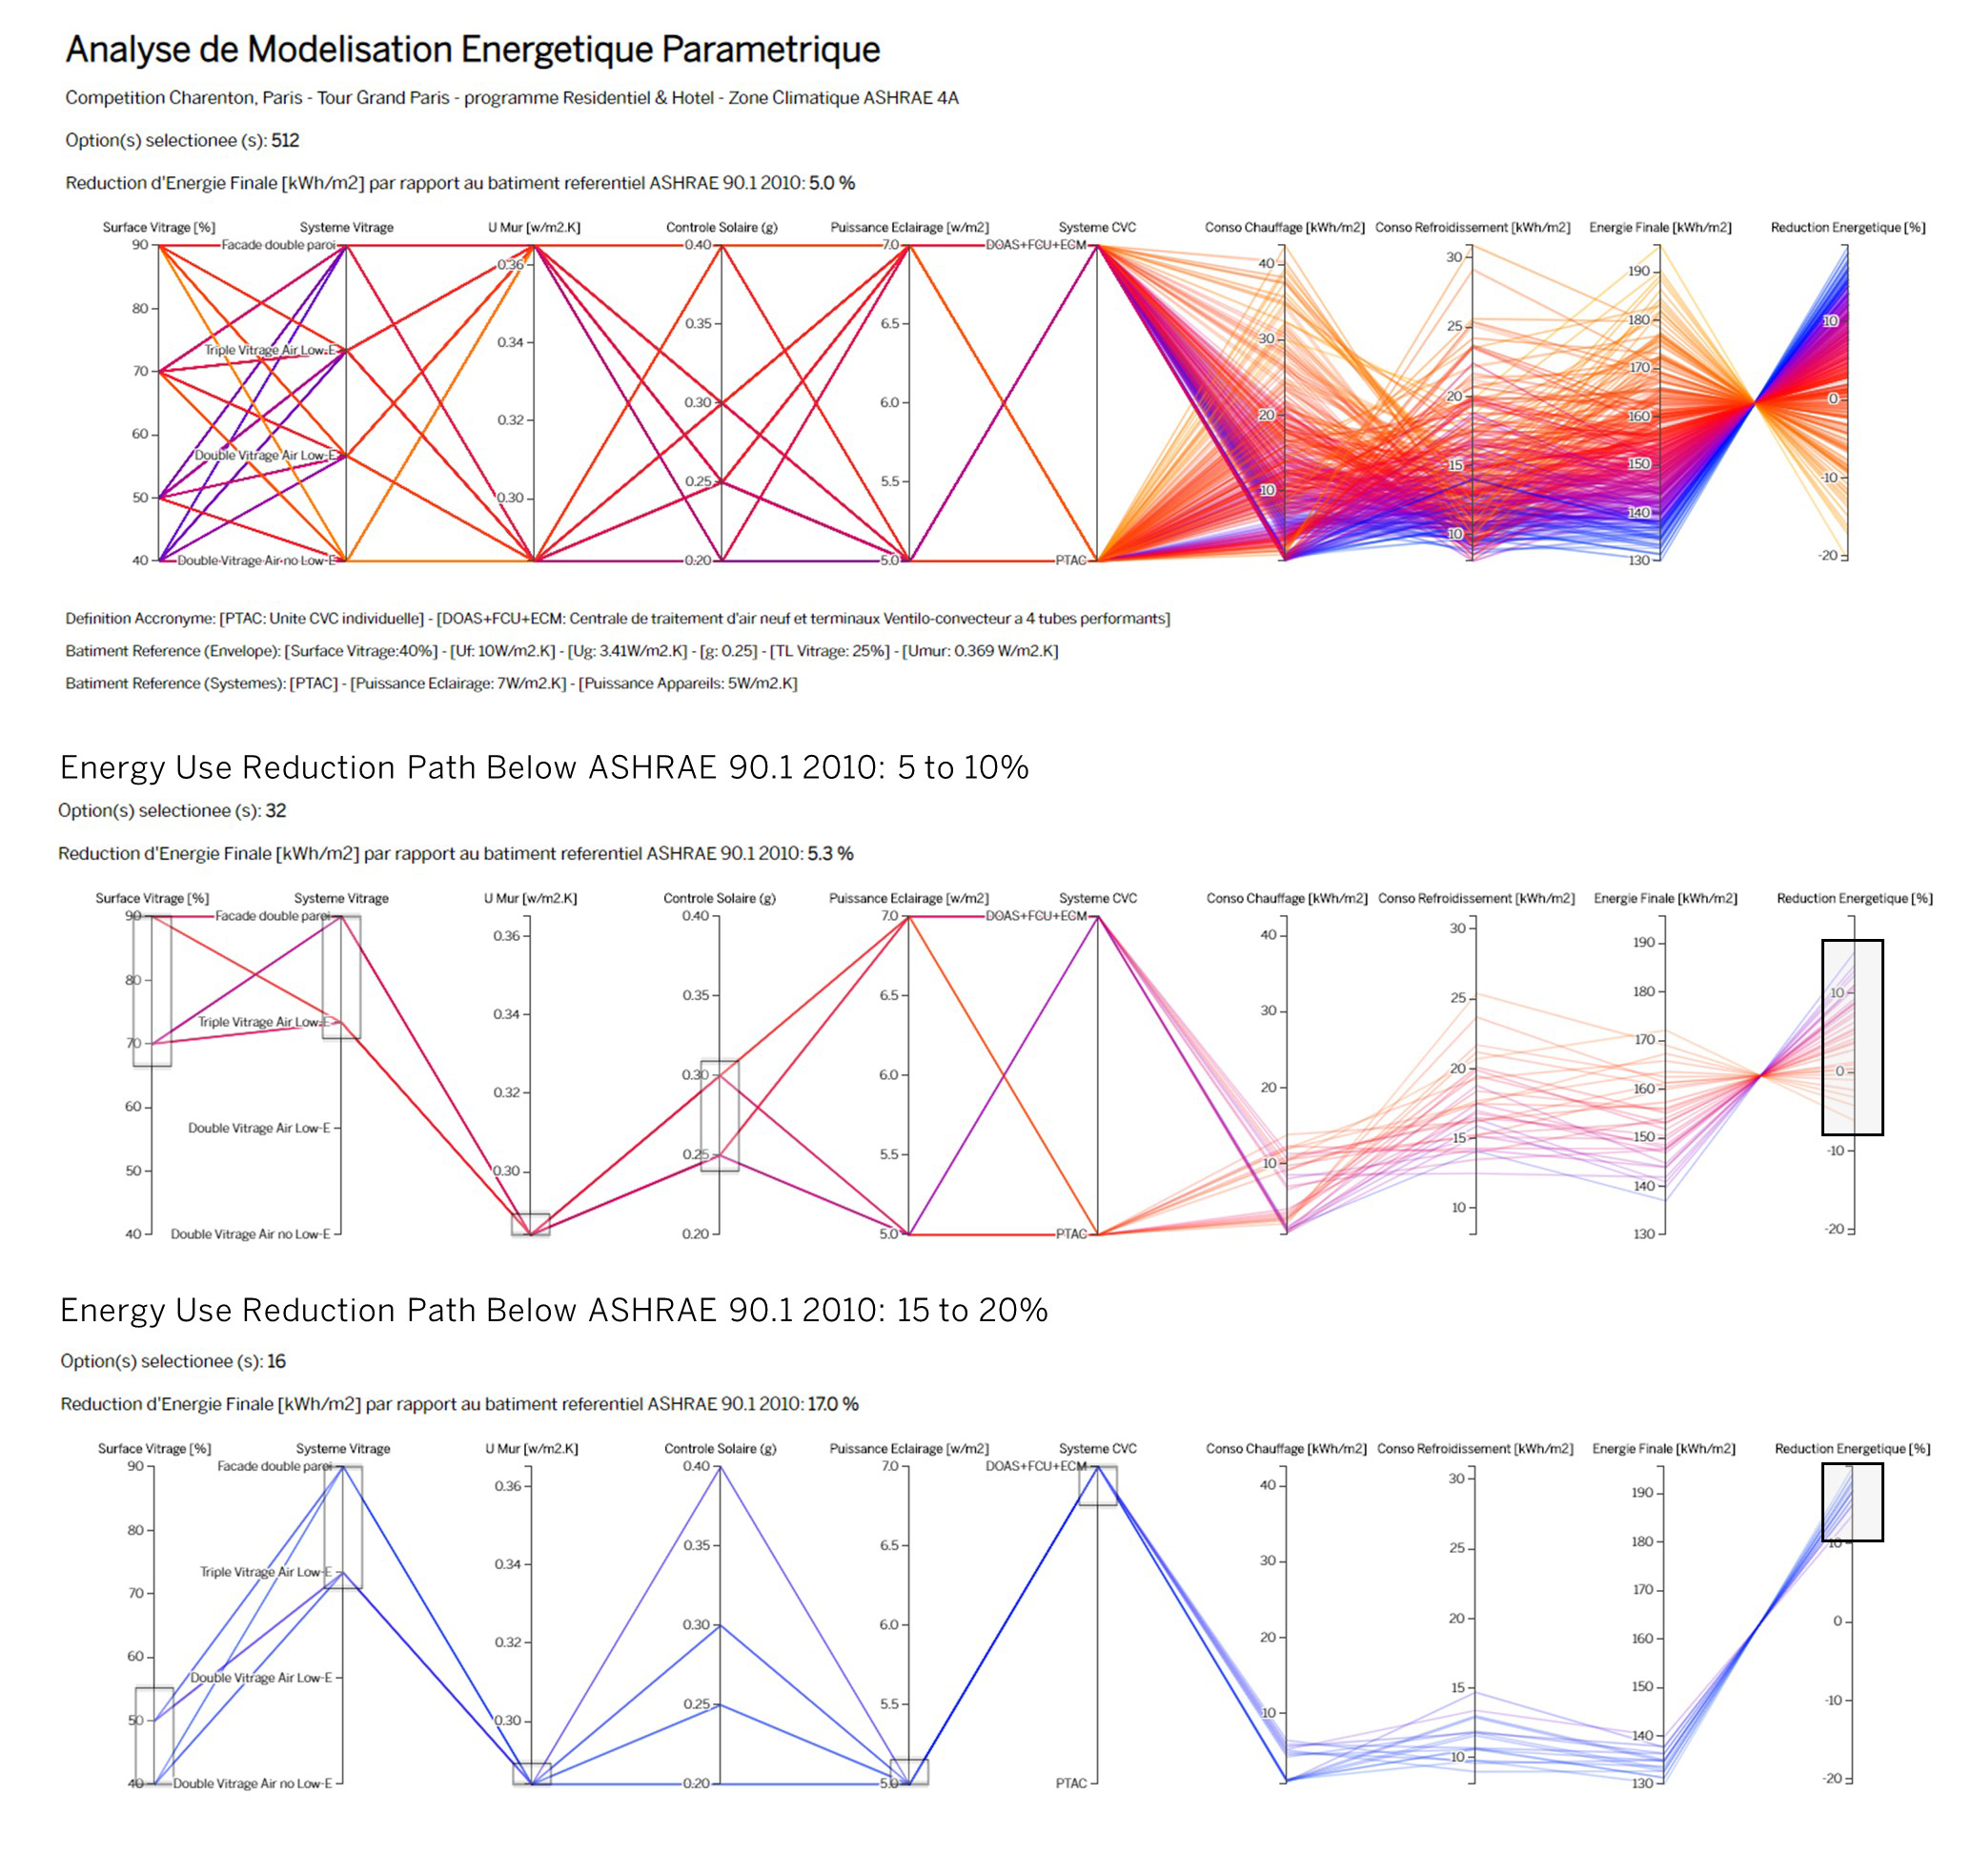
Parallel Coordinates
Window-to-wall ratio, Double Glazing, SHGC, R-Value Wall, Light Power Density, HVAC system
Graphic Information
The graph highlights all the possible permutations computed for the variable studied. The baseline is based on ASHRAE 90.1 using the inputs of a residential building with a Packaged Air Terminal Conditioning system. Passive and Active design strategies are successively shown in the graph from left to right. The results are shown on the far-right side expressed in % energy savings The in-house Sustainability Engineering Studio and Digital Group have developed a multidimensional interactive interface reading energy modeling parametric simulations to visualize the magnitude impact of architectural and engineering decisions at the scale of the whole building weighting causality and effect. This interactive interface allows to seek for an optimal decision thinking approach. Over 500+ annual simulations have been run in parallel including passive and active design strategies. The subtle combination of design strategic choices allows a visual clear connection between inputs and outputs. Over an annual basis, the overall energy use of the building is a function of the heating and cooling loads on the HVAC system impacted by the cold and hot Parisian climate fluctuating during the year modulated by solar radiations, cold temperature and tied to the human activity of the tower. The building envelope plays a prevailing role in the whole building efficiency, acting as a buffer or thermal blanket to reduce the heat gain and losses through the assembly. The increased insulation in the opaque walls and triple glazing unit with low-e coating reduces heat transfer while maximizing the daylight penetration with a high visual light transmittance coefficient. Using a selective insulated glazing unit allows the optimization of the light-to-solar gain factor. The active system uses a decoupled ventilation from the cooling and heating terminal units to respond more efficiently with a water-based HVAC system using Fan Coil Units to the loads of the building and to provide 100% fresh air. An enthalpy heat recovery wheel located at the air intake and exhaust of the tower further improves the efficiency of the building. Finally adding PV panels on the roof of the adjacent massing of the project will further reduce the energy use of the whole project.
- Used D3 - a JavaScript library for producing dynamic, interactive data visualizations in web browsers. - Download d3.parcoords (parallel coordinates) open source code - Modify & add Functionalities to the code - Ran a shoebox energy model using jEplus and Open Studio - Created an excel spreadsheet csv file with inputs and outputs - Link the database csv file to the D3 HTML code - Designed and Formatted with the firm Standard - Visualized the tool running a Javascript Node Server locally or on an intranet server
To understand the magnitude impact of design decisions very quickly and simultaneously. An interactive engaging exploration tool reading pre-run simulations Leverages high multidimensional results of large-scale dataset
Allows designers to simultaneously see the impact of design solution on multiple performance criteria.
Customizable and optimized for storytelling. Provides real-time feedback to Design Team to highlight major findings
Add the upfront cost of the design variables to weight in the return on investment and payback period
This is a joint effort of 3 people: - Olivier Brouard, Sustainability Engineering Team Leader - Eric Anastas, Digital Designer - Jason Kirkpatrick, Building Performance Analyst - Sergio Sadaba, Mechanical Engineering Team Leader