PROJECT INFORMATION
Daniel Glaser
3d Diagram
3D Geometry (in SketchUp, Rhino, Revit format), Material properties (glazing VT, paint reflectances, shade BSDF files, etc), Space Definitions, Geolocation, Climate Data, Blind and Hysteresis Triggers
Graphic Information
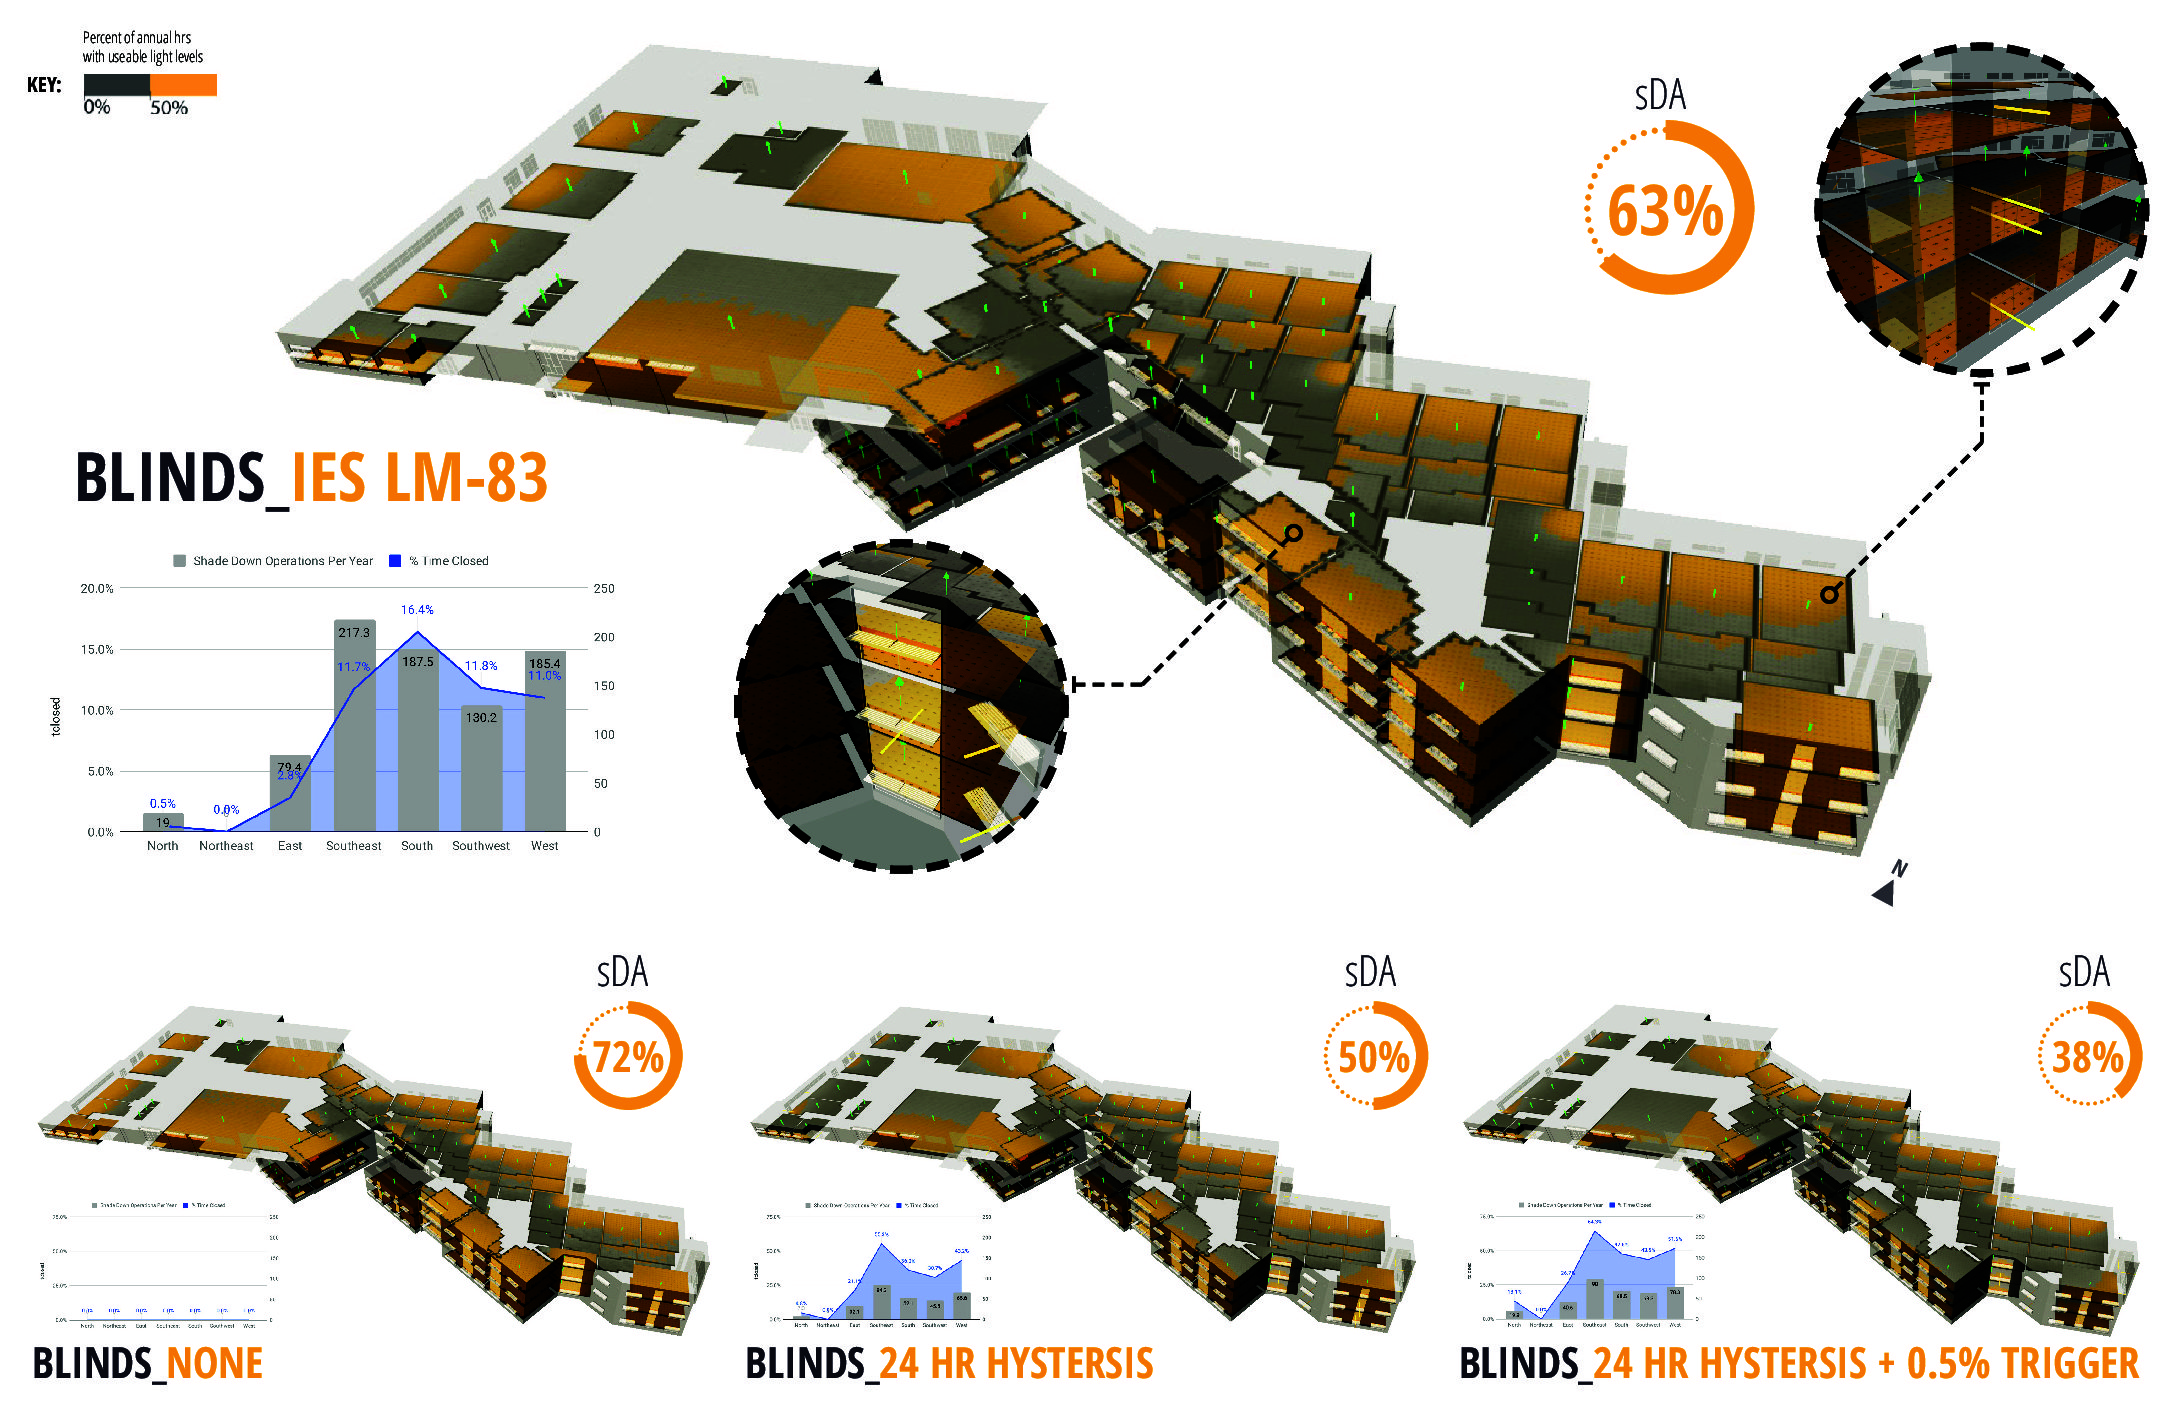
Overall the chart illustrates how the sDA score is highly dependent on whether or not blinds are used and if they are the blind algorithm. The accompanying table for each building graphic illustrates how the number of blind triggers and % time closed vary by orientation. The building graphic shows a traditional Spatial Daylight Autonomy (sDA) plot, separating out passing and not-passing scores by color. It also shows yellow “sticks” pointing out of the facade which are at the centroids of blind groups. According to IES LM-83 blinds should be broken into groups based on orientation as well as its view to the sky. It also shows green vectors which identify the light measurement direction of each space of the analysis. It shows raw sDA scores under 4 conditions: the approved IES LM-83 definition which includes blinds, by not using any blinds (which will overpredict sunlight), passive occupants who wait 24 hours before they adjust their blinds, and passive occupants who wait 24 hours before they adjust their blinds but are more sensitive to direct sun ingress and have a 0.5% floor area trigger.
This is a joint entry from Kevin Harris and Kari Founier of Vedacity and Daniel Glaser of LightStanza. The building was analyzed in LightStanza for Spatial Daylight Autonomy under four separate blinds operation conditions. 3D images for the four analysis’ were generated using Lighstanza’s graphic user interface and exported to Photoshop for layering, filtering, and image adjustments. Data derived from Lightstanza was analyzed in Google Sheets into visual graphs for all analysis. The images for all four design conditions were laid out in InDesign with multiple visual elements added for clarity.
Spatial Daylight Autonomy (sDA) is the first daylight performance metric that considers the human factors of blind operations. This graphic was originally made to explain why some north-facing spaces outperformed the south-facing spaces, which may be counter-intuitive for a metric with a lower-bound of 300lux and no upper bound. The blind closures indirectly account for glare which is part of the sDA formula. These graphics were used to add shading devices to optimize sDA scores as well as to explore the possibility and consequences that occupants may only be passively involved with adjusting their shades.
The primary purpose of the graphic is to visualize facade locations which will require additional sun control to mitigate glare conditions while also determining which spaces will be fully daylight autonomous during standard hours.
We believe the balance between simplicity and rigor. Today, blinds are usually omitted in most daylight analyses. This graphic shows the importance and sensitivity in using blinds in scoring daylight sufficiency as well as how it can be a powerful tool for optimizing facade design by orientation.
The thresholds for sDA could have been parameterized to show the effects of using different bounds for the sDA formula including a 24 hour hysteresis to model passive occupants, more varieties of trigger areas, different shade cloths, as well as target %sufficiency and illumination. In addition charts could illustrating a progression of scores optimizing solar design. Lastly, analytics on the aggregate sDA scores of several buildings could be illustrated.
Can you please add a field for co-authors of graphics?