PROJECT INFORMATION
Elliot Glassman
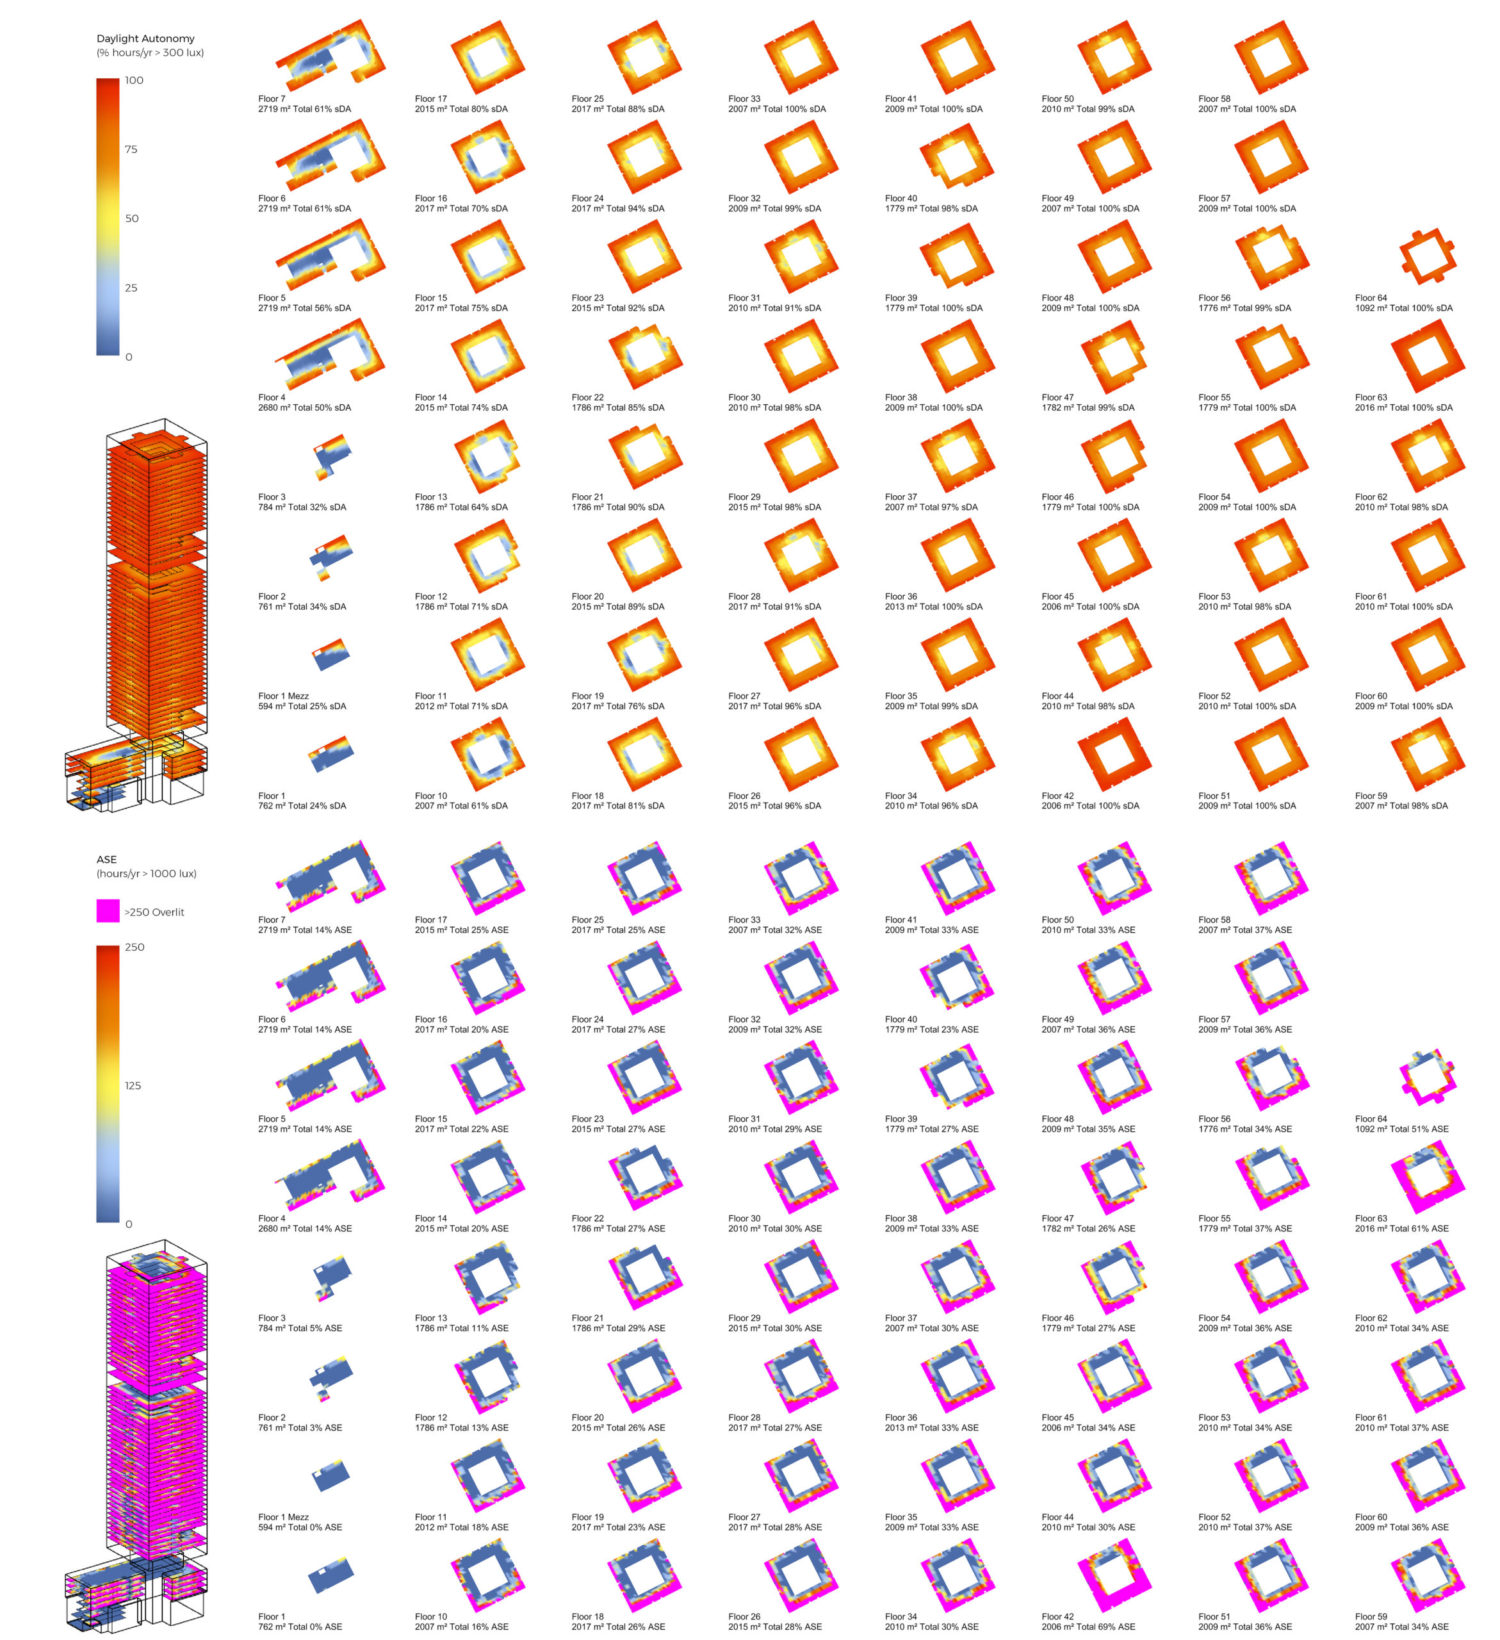
2d False Color
Surrounding buildings, façade properties such as window to wall ratio (WWR) and visual light transmittance (VLT) of the glass.
Graphic Information
The graphic shows the mass of the tower with the sDA and ASE result files and then the individual floor plates unrolled into a matrix of results.
A Grasshopper script was used to generate the daylight model from a base massing geometry and specified facade parameters and floor heights. The script then performed the daylight analysis and then unrolled the meshes of the daylight result to create a matrix of floor by floor results that was exported to image format.
The investigation was how the buildings surrounding the project would affect the daylight performance along the height of the tower. On the lower levels, contextual overshadowing would limit daylight, while on the more exposed upper floors the may be glare from direct sun. The graphic was to aid in an understanding of the daylight and direct sun on every floor and if any façade alterations needed to be provided to the facade.
The script that produced this graphic generated a lightweight daylight model from massing volumes and some facade parameters also ran the analysis and provided the results in an accessible manner. Since the workflow and visualization was managed by the script, this allowed more time to study the results and produce alternative façade options.
At a glance, one can see how the overall building is performing, yet it is possible to focus on a particular floor to understand the daylight performance and inform more localized design decisions.
Find a way to have the script define the boundary of well daylit area (balancing daylight and glare)