PROJECT INFORMATION
Various Charts
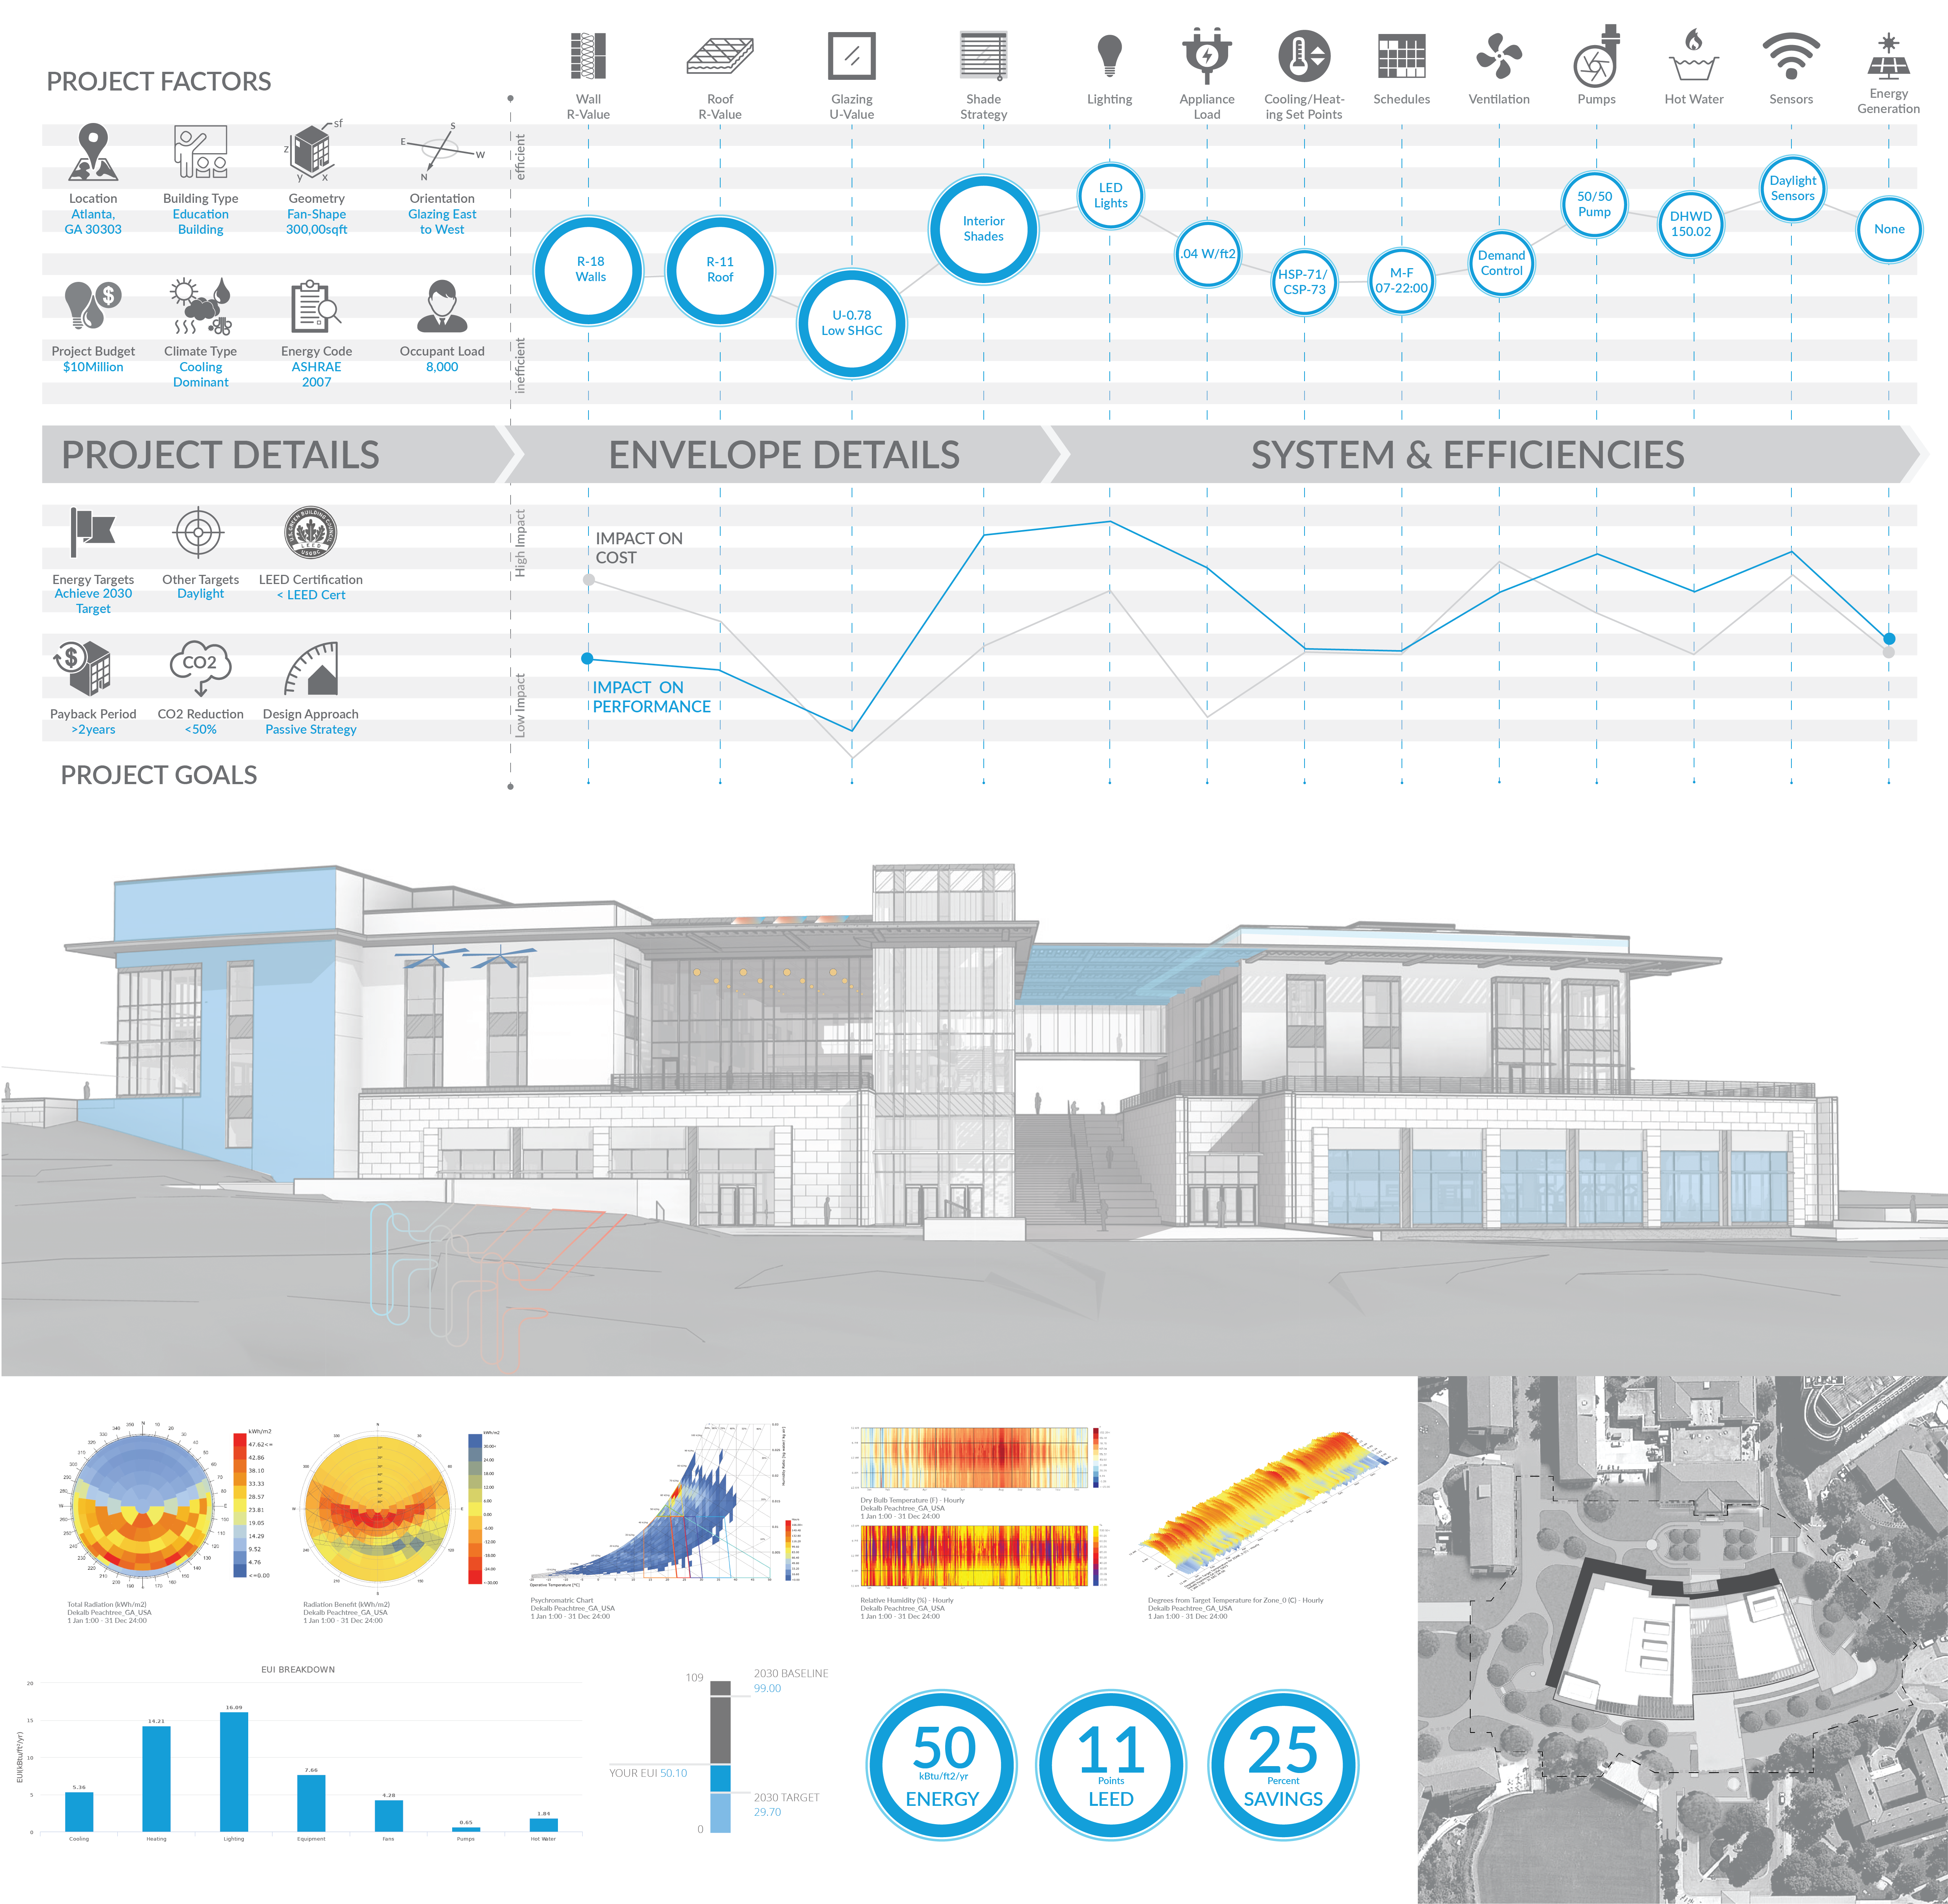
The inputs are shown at the very top band of the graphic which includes insulation qualities of wall, roof, and glazing, lighting power density, electrical power density, building schedules, and mechanical system types, as well as the initial project factors (top-left) that initiate every building design. This band of inputs list the most crucial of all building parameters which most shape the final building cost and performance results.
Graphic Information
This graphic is about capturing the bigger picture. Here we are taking the workflow used in cove.tool to evaluate various building factors to see how their interaction can help make a data-driven decision. Each band is both a summary and a breakdown of different aspects which once joined together makes a big picture scoop of where the projects stands and how its components and efficiency contributed to that result. A really great workflow when you think of using energy modelling to convince both the budget conscious building owner, design infatuated architect, and relentless sustainability champion.
The diagrams and results in the graphic are taken from cove.tool, an early stage building performance and cost analysis tool. The inputs and project images are taken from a real project where we used cove.tool to find and optimize a project bundle which best satisfies all of our project goals, as they stood at one point in time – early stage. These were then put together in Adobe Illustrator.
How can the metrics inherent to every building component/ project goal/ design decision, be used to automate a best-case input configuration?
This graphic is just a slice of several cove.tool runs and design iterations which makeup the early stage design process. Although capturing a single bundle configuration, this graphic has done a great job indicating the direction of the project as well as pointing out where the project falls short and areas of covert opportunity.
Possibly more important that the final energy and savings results, is the two impact streams diagram which allows the viewer to visualize the benefits and disadvantages of each selection. By comparing a building’s design by the fine-tuning of its components, users can really begin to understand the breathing room and capabilities of a data-driven energy analysis tool.
I would have liked to have expanded the input columns to denote more options and really allows viewers see how we were able to select the best products and efficiencies on the terms of our project goals and real world factors. There is a heavy parametric influence happening in the background that was quite difficult to visualize, and I would have like to shown the strict data-driven and flexible capabilities of the tool and how great it can be used to satisfy all members in the design team.