PROJECT INFORMATION
Mansi Dhanuka
Jacobs
Jonathan Weiss, Fred Kaulbach, Richard Wilson
- Adobe Photoshop
- Grasshopper Honeybee
- Grasshopper Ladybug
- Rhino
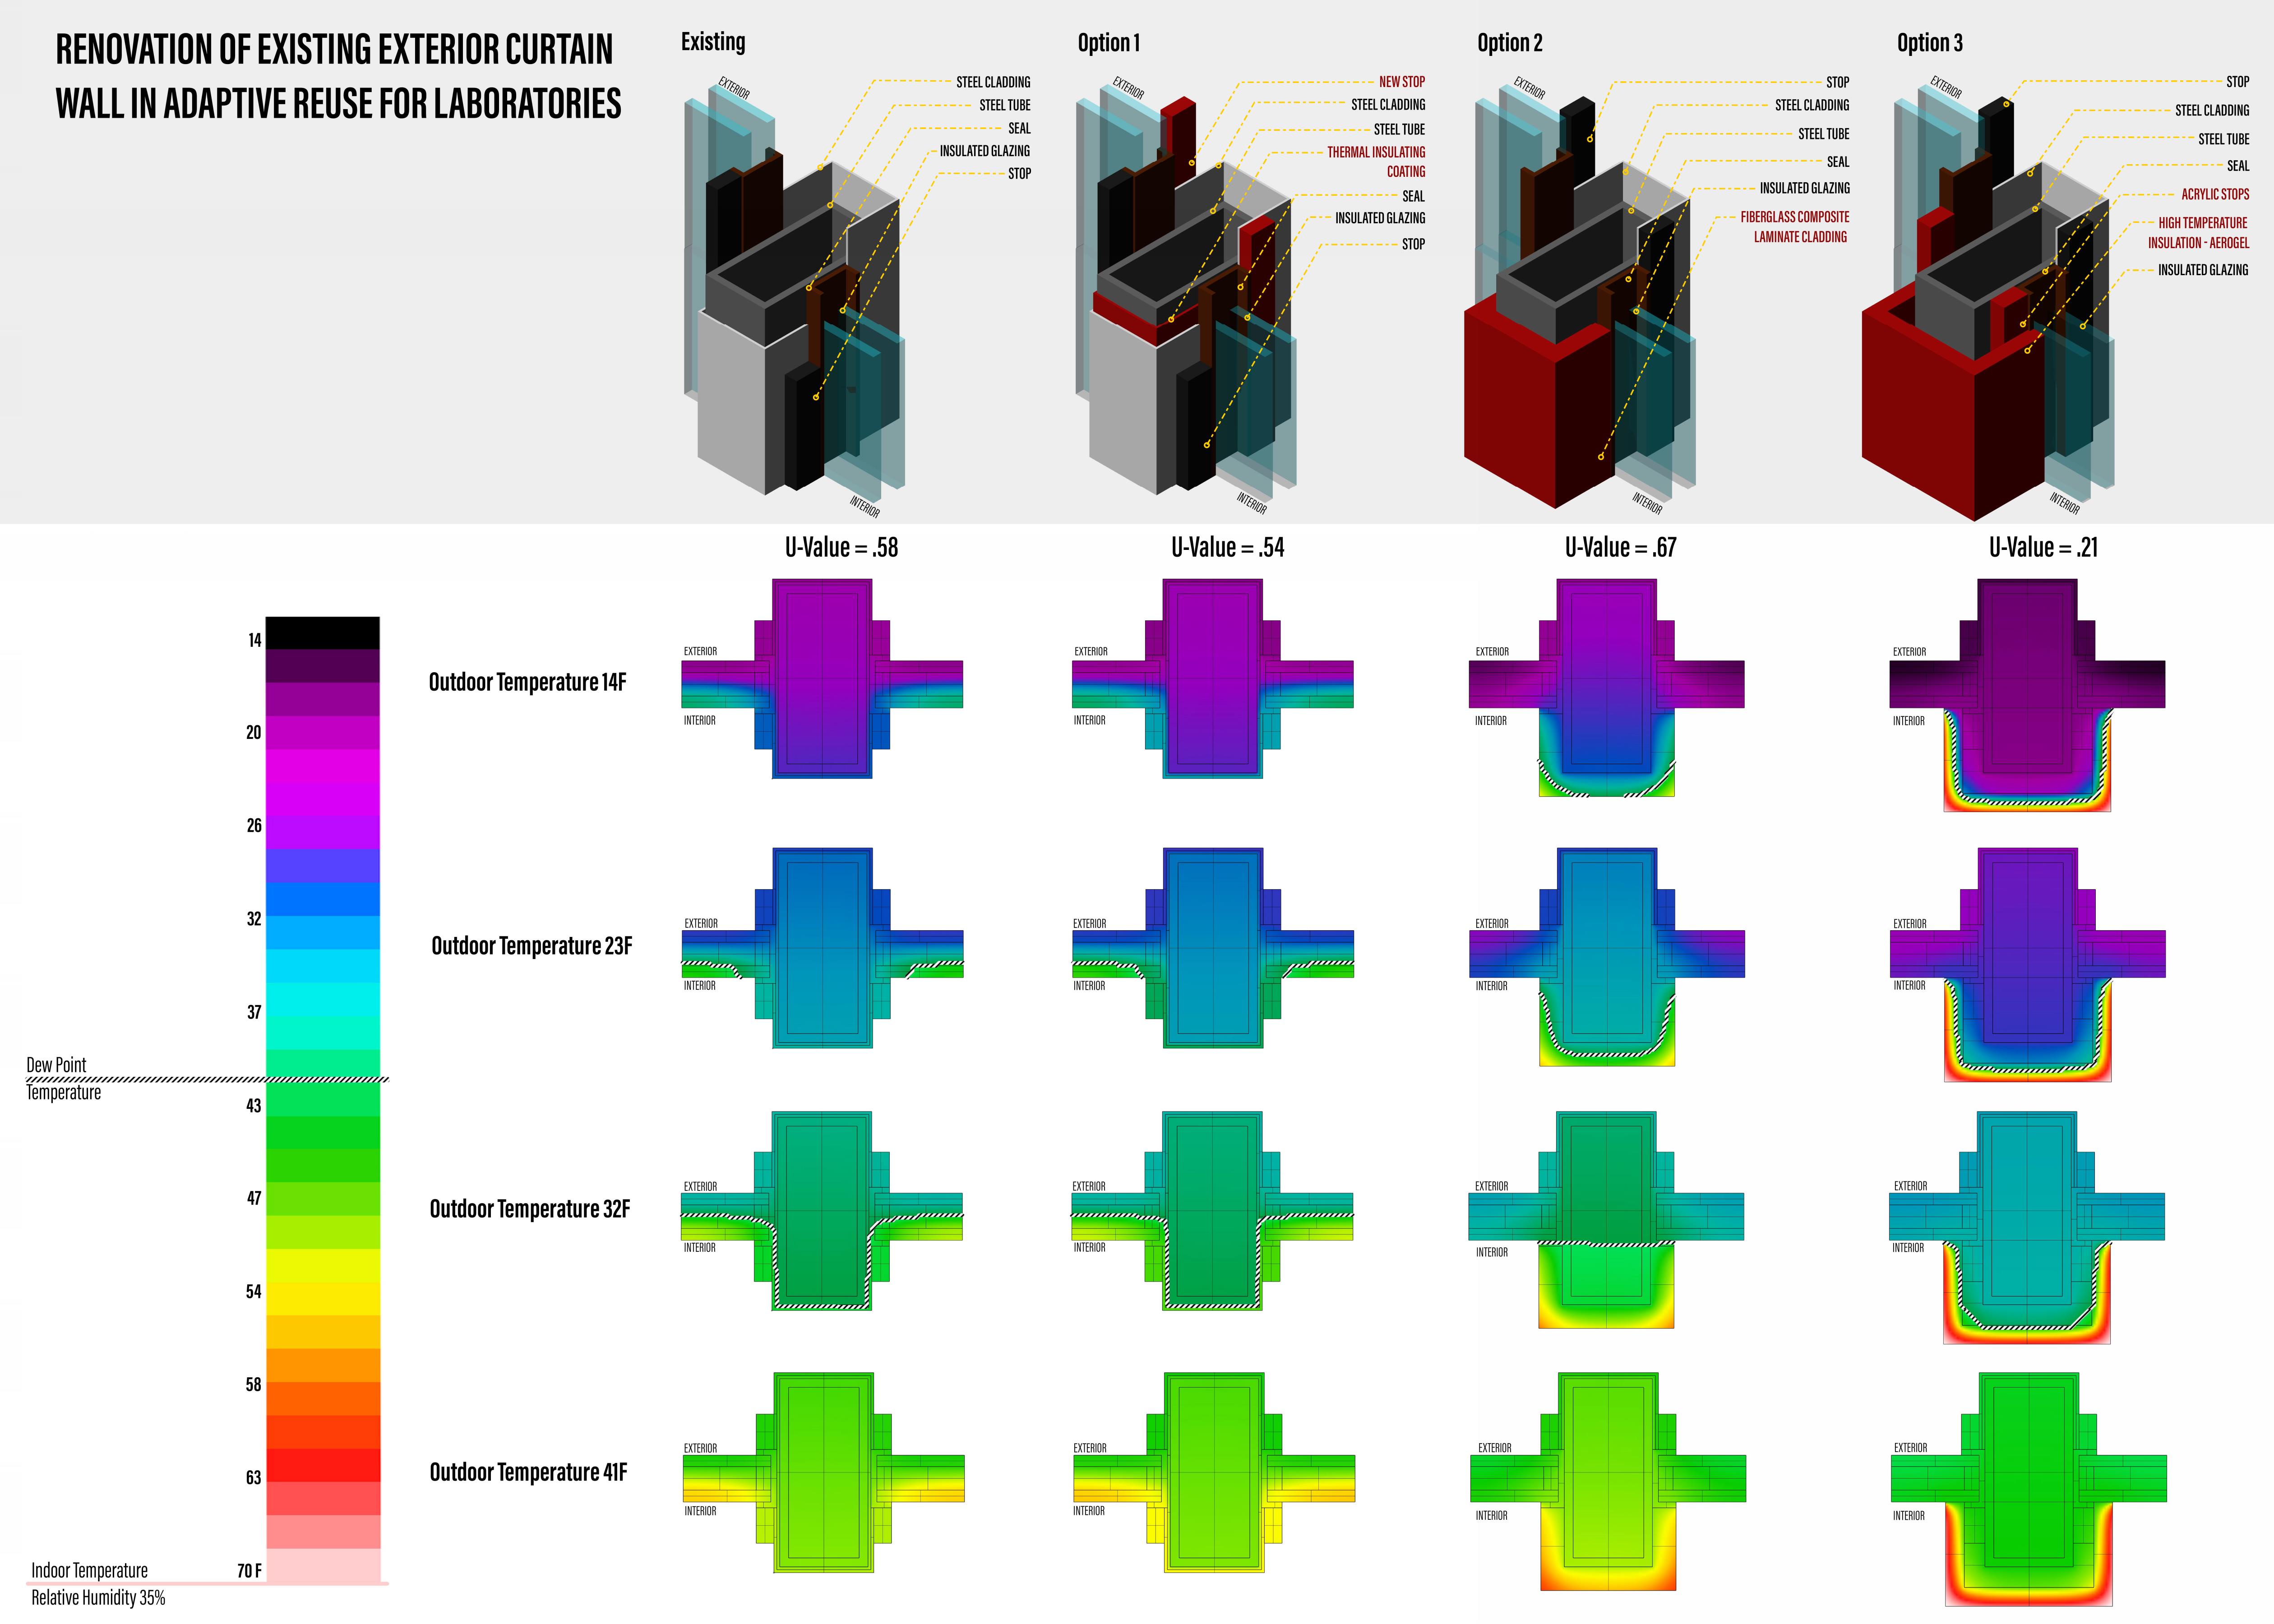
The graphic is a comparative representation of different window sections and the effect of environmental factors on them.
Climate Data, Window section detail/material, conductivity of Materials
Graphic Information
The graphic portrays window section options in isometric and envelope heat transfer through those options at different winter month temperatures. It depicts the risk of condensation in each of the options with effective U-Values of construction.
Rhino was used for modeling and rendering the mullion detail sections. Therm combined with Ladybug-Honeybee for the envelope heat modelling and condensation risk analysis. Post-simulation using Photoshop and Bluebeam.
What happens to the renovated laboratory spaces in an existing building, over differing humidity? Would it lead to condensation inside the Lab Space? How can we reduce energy loss through the exterior enclosure while maintaining the minimal vertical mullions?
Since, it is a retrofit of existing strip windows on historically significant mid-century modern building, the design / construction team identified costs associated with different treatments, and design leads considered the visual impact of different thermal interventions on the existing exterior envelope fabric.
It clearly shows the different options all in one graphic, for ease of comparison between environmental factors and visual aesthetics.
We would have integrated with an energy model of the space for studying the energy use impacts of the building envelope.