PROJECT INFORMATION
Nikhilesh bist
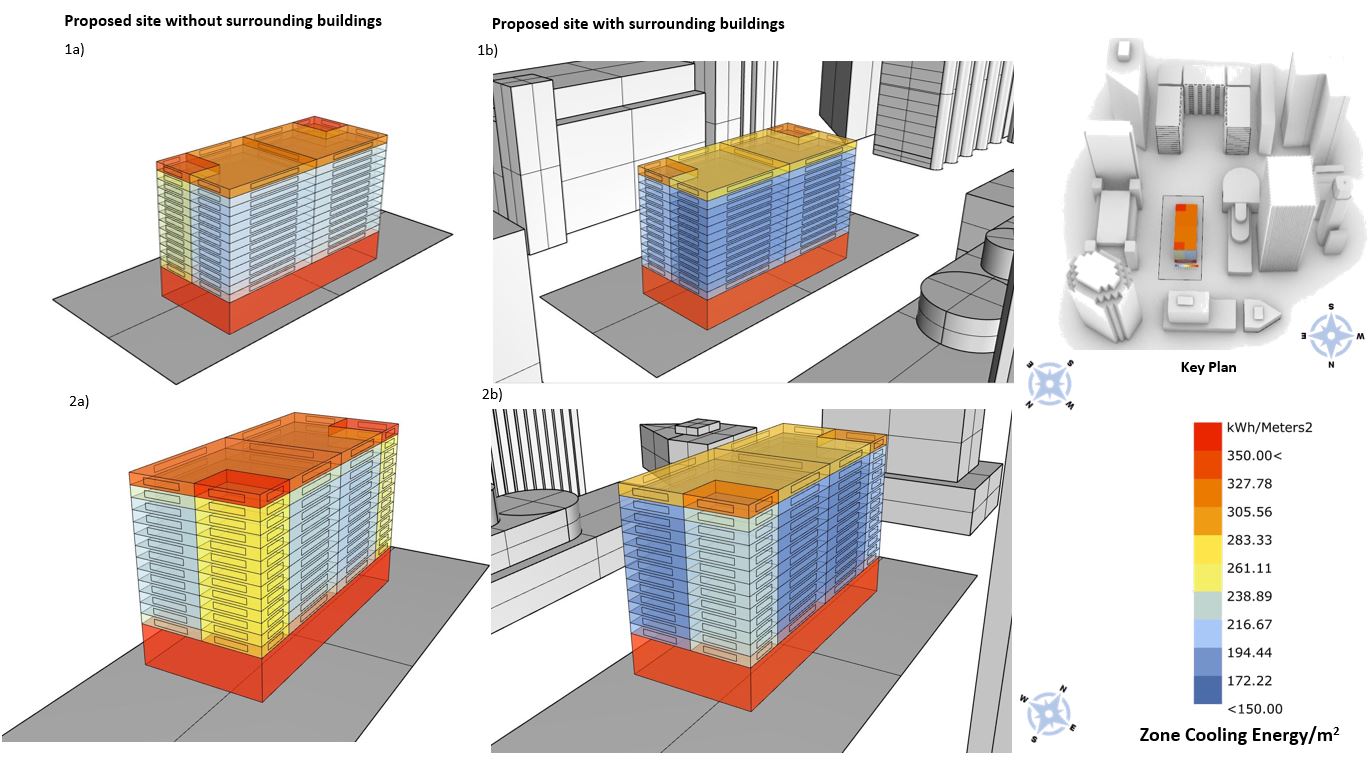
3d with False Colors
Architectural & HVAC design, Thermal zoning, Site Surrounding buildings Surrounding building context
Graphic Information
This graphic shows the comparison between zone cooling energy consumption when it is simulated with respect to the surrounding buildings and when it is not. Image 1a) & 1b) shows the zone cooling energy consumption on North & West Facade with and without surrounding buildings. Image 2a) & 2b) shows the zone cooling energy consumption on South & East Facade respectively. The ground floor shows the highest cooling energy consumption due to no window provide in that zone, resulting in entrapment of heat from the building envelope which is having a penalty on the HVAC system, ground floor cooling energy consumption is more dependent on internal load instead of external load, hence very little impact of surrounding buildings is seen on cooling energy consumption . There is a drastic change in the cooling energy consumption on the southwest zone due to the taller buildings in the southern region of the site. Lower morning & evening sun angles are blocked by surrounding building on the east and west side.
The surrounding buildings with the proposed architectural design were modeled in Rhino. Annual shadow range was generated through the ladybug plugin to understand the shadow impact of surrounding buildings on the proposed design structure. Each thermal zone was made in accordance with the architectural floor plan to see the impact of cooling energy on each zone. Each zone was assigned a default HVAC system as per Honeybeen HVAC components. An annual simulation was conducted to see the impact of surrounding buildings on zone cooling energy consumption.
As a general practice ( worst day scenario), surrounding buildings are not considered during HVAC design analysis, resulting in oversizing of the HVAC system. This increases the CapEx & OpEx of the HVAC system. To optimize the HVAC system and to check the impact of shadow on the proposed design, this exercise was carried out.
Initially, the graphic was intended to study the shadow patterns and its implication on cooling energy consumption. However, after this analysis many other designs related queries were generated regarding daylighting, insulation thickness, zone placements. This analysis was an initial step to understand the impact of the surrounding environment of the site on the proposed design. The important thing which I learn from this exercise was that how can you take advantage of your weakness( Tall surrounding buildings).
Theoretically, it is evident from the site, since there are tall structures surrounding the site so there will be high shadow ranges from it. But to quantify the percentage impact is very crucial in early design stages. This graph clearly indicates the impact of shadow from surrounding buildings on zone cooling energy consumption of the proposed design.
See the impact of the surrounding buildings on indoor thermal comfort conditions. Plot hourly operative temperatures to see the comfort condition on each zone. Check for optimization of the building envelope (optimum insulation thickness) and its impact on cooling load and thermal comfort.