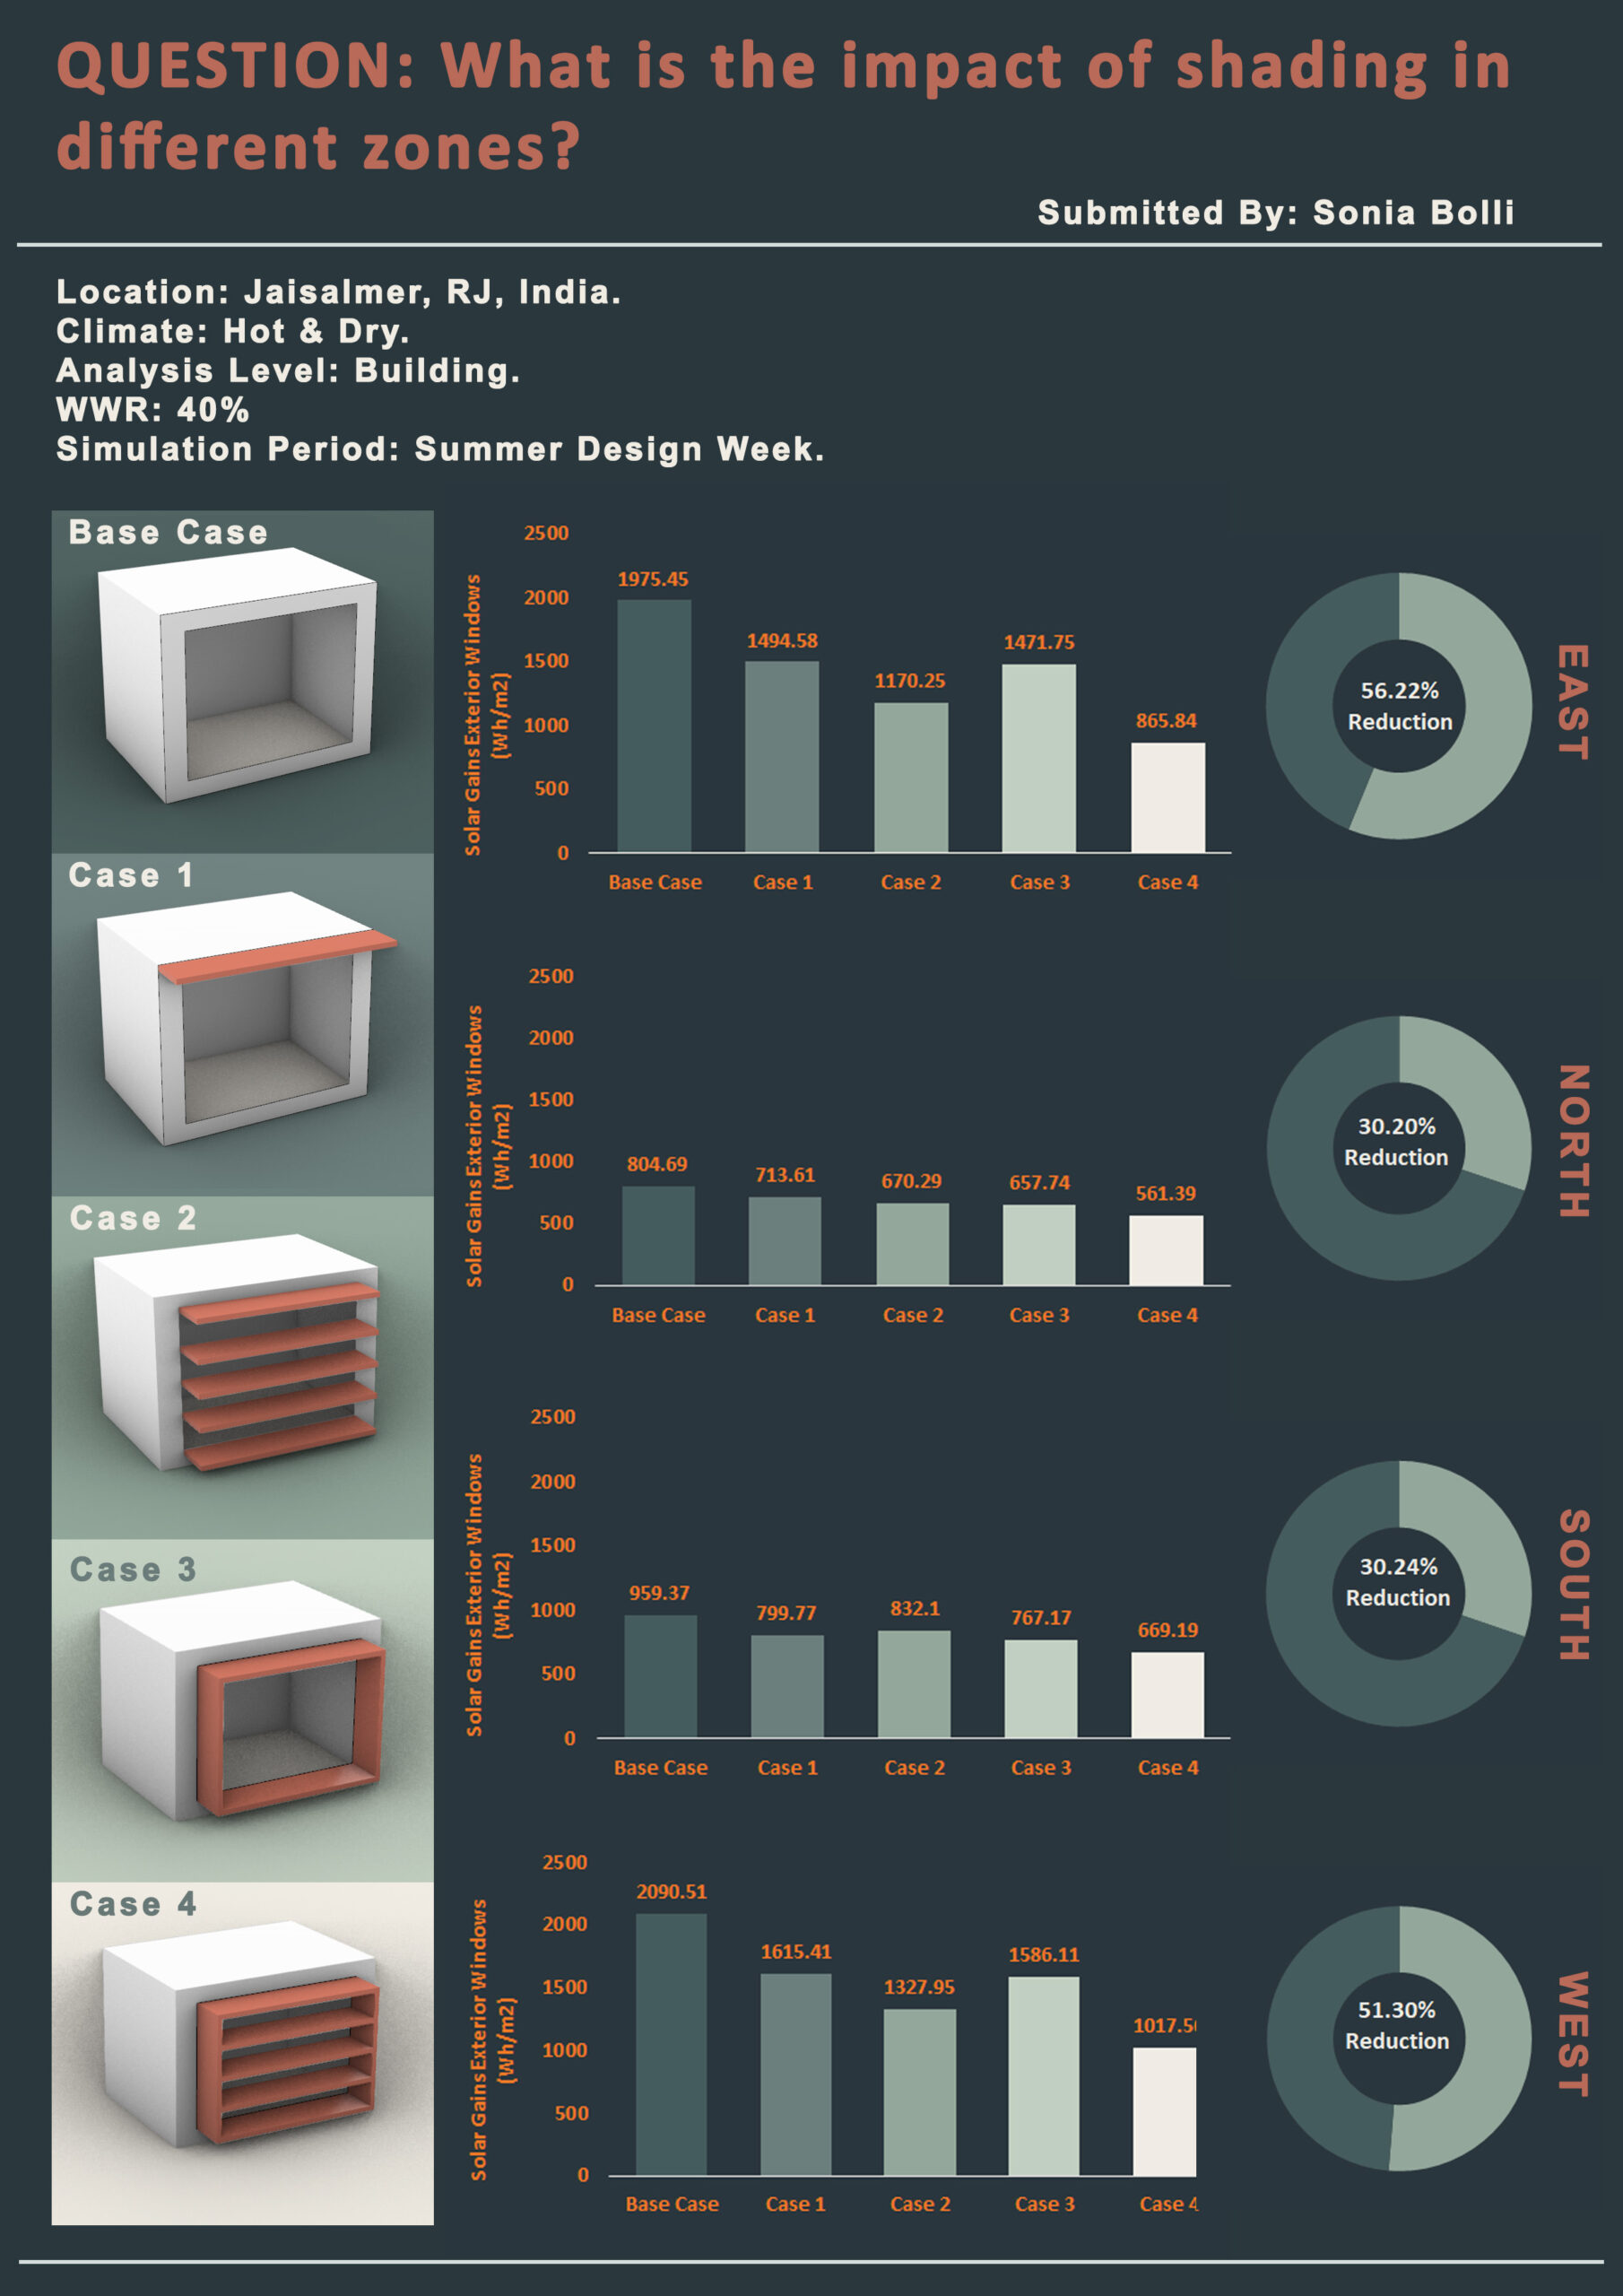
What is the impact of shading on cooling loads?

Project Location: Zone 0B Extremely Hot Dry
Simulation Scale: Floor Plate
Application: Conceptual
Audience: Academic
What is this graphic showing? Describe the different parts of the graphic and how it communicates the data.
The data showcases the impact of five different shading types on solar heat gains through windows for four cardinal orientations: east, north, south, and west. Shading techniques effectively reduce solar heat gains across all orientations, with the most significant reductions observed when combining multiple shading strategies. As a result, this leads to a reduction in the building's cooling load.
What type of graphic is this?
- Diagram
Design Variables
- Window shading/sun control
Is this part of the ASHRAE-209 cycle?
What tools were used for the simulation analysis?
- Design Builder
- EnergyPlus
- Excel
What tools did you use to create the graphic?
- Adobe Photoshop
- Excel
What was successful and/or unique about the graphic in how it communicates information?
It communicates information by presenting clear and concise data on the impact of different shading types on solar heat gains across various cardinal orientations. Its success lies in its ability to visually represent complex information in a straightforward manner, providing valuable insights for optimizing building energy efficiency.
Is there anything else you would like to mention?
Included in the competition:
2024 Annual Project StaSIO Challenge - Deadline 03.30.24
January 18, 2024-November 22, 2024

