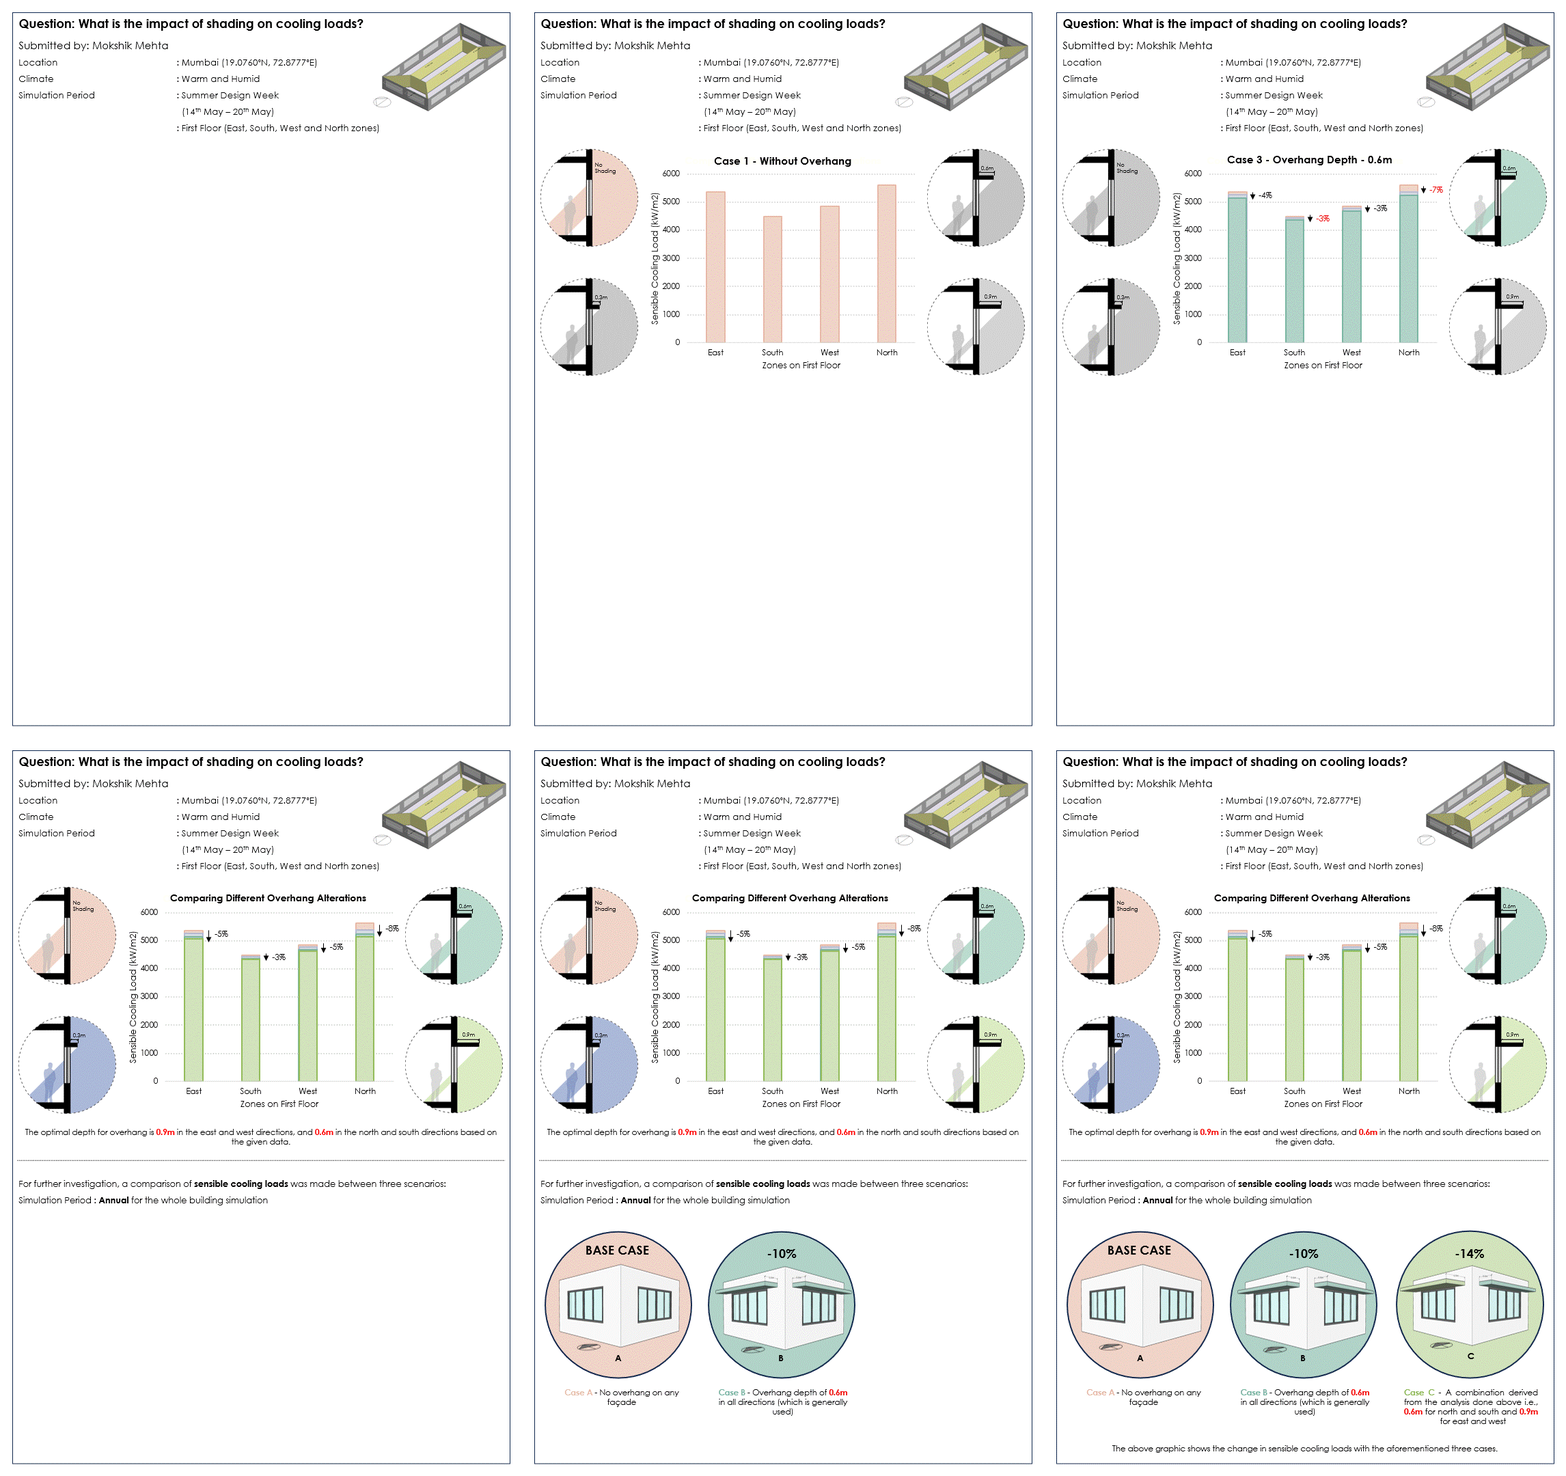
What is the impact of shading on sensible cooling loads?

Project Location: Zone 0A Extremely Hot Humid
Simulation Scale: Shoebox Model
Application: Conceptual
Audience: Architect/Designer
What is this graphic showing? Describe the different parts of the graphic and how it communicates the data.
1. Primary inputs of the analysis: Parameters for building model data: dimensions, material specifications (e.g., U Value for Wall, Roof, Glazing), SRI Value for Roof, SHGC Specification for Glazing, Window-to-Wall Ratio (WWR), and Overhanging Configuration. 2. Primary outputs of the analysis: Sensible Cooling Load breakdown for each zone (east, south, west, north) on the first floor in the primary analysis. Total cooling loads for the entire building in the secondary analysis. 3. Outcomes of the investigation: a. The investigation revealed the importance of determining the optimal overhang depth for each direction by comparing cooling requirements at varying depths. b. After analyzing the data, it was found that the south and north zones did not show a significant decrease when the depth was increased from 0.6m to 0.9m. c. c. c. Therefore, 0.6m was chosen as the optimal depth for these zones. However, the east and west zones require a higher vertical shading angle (VSA), and the maximum depth in the analysis is 0.9m. Therefore, 0.9m is the optimal choice for east and west. d. Once the optimal depth is identified, it is compared with two other scenarios: one without any overhangs and another with a standard (usually followed in practice) overhang depth of 0.6m on all sides. e. The investigation highlighted variations in solar incidence across different directions, suggesting the need to tailor treatments for specific facades based on their unique requirements. f. According to the investigation, it is not necessary to have the same overhang depth across the building facade. Case 3 can be a considerable option for varying depths.
What type of graphic is this?
- Animated gif
- Table / Chart
Design Variables
- Glass U-value / SHGC
- Passive strategies
- Window shading/sun control
Is this part of the ASHRAE-209 cycle?
What tools were used for the simulation analysis?
- Design Builder
- EnergyPlus
What tools did you use to create the graphic?
- Adobe Photoshop
- Excel
- PowerPoint
What was successful and/or unique about the graphic in how it communicates information?
The animated graphic (gif) facilitates easy comparison of different scenarios by overlaying the data, simplifying the focus on individual aspects at a time.
Is there anything else you would like to mention?
Included in the competition:
2024 Annual Project StaSIO Challenge - Deadline 03.30.24
January 18, 2024-November 22, 2024

