What is the impact of Insulation on indoor operative temperature?

Project Location: Zone 0A Extremely Hot Humid
Simulation Scale: Shoebox Model
Application: Conceptual
Audience: Architect/Designer
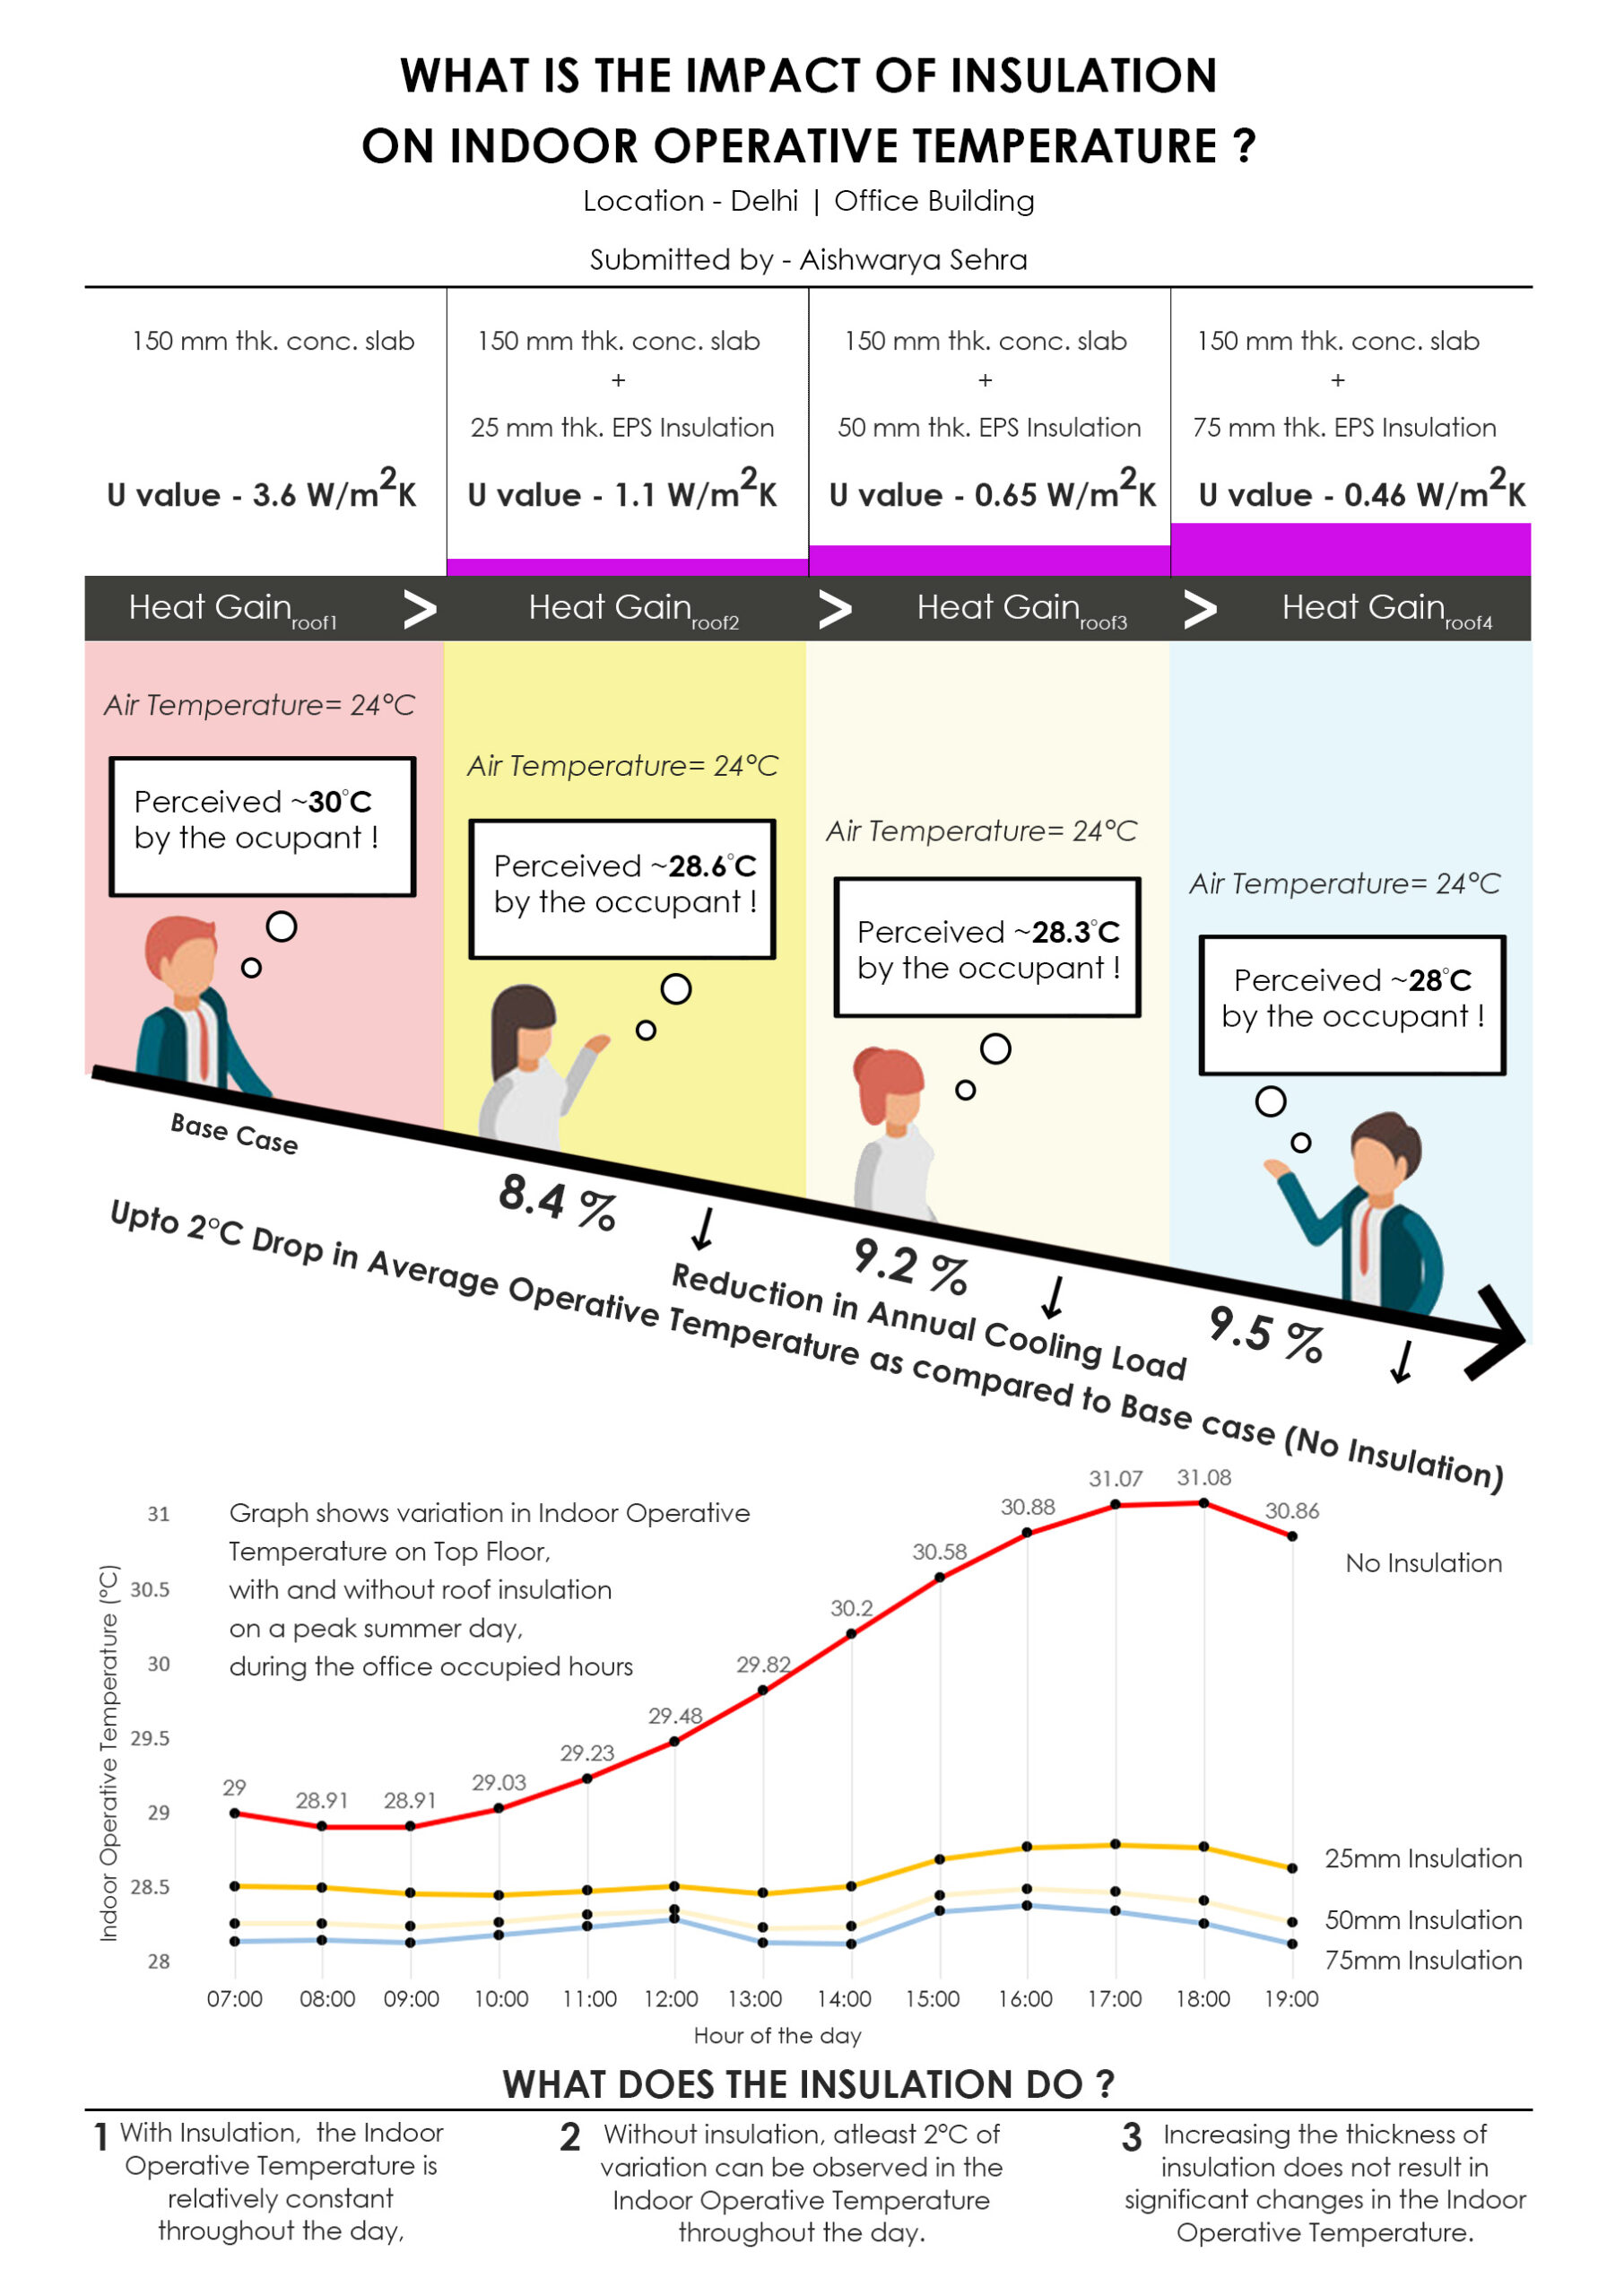
What is this graphic showing? Describe the different parts of the graphic and how it communicates the data.
a. Insulation plays a crucial role in reducing annual cooling loads and maintaining Indoor Operative Temperature in buildings. b. Insulation maintains the Indoor Temperature by slowing down the heat transfer process. With Insulation, negligible variation was observed in the Indoor Operative Temperature, whereas without insulation, atleast 2°C of variation was observed throughout the day. c. Increasing the thickness of insulation does not result in significant changes in the Indoor Operative Temperature.
What type of graphic is this?
- Other
Design Variables
- Passive strategies
Is this part of the ASHRAE-209 cycle?
What tools were used for the simulation analysis?
- Design Builder
- EnergyPlus
What tools did you use to create the graphic?
- Adobe Photoshop
- Excel
What was successful and/or unique about the graphic in how it communicates information?
The illustration style and the composition of the graphic effectively facilitated the communication of the complex technical results of the investigation in one glance.
Is there anything else you would like to mention?
Included in the competition:
2024 Annual Project StaSIO Challenge - Deadline 03.30.24
January 18, 2024-November 22, 2024

