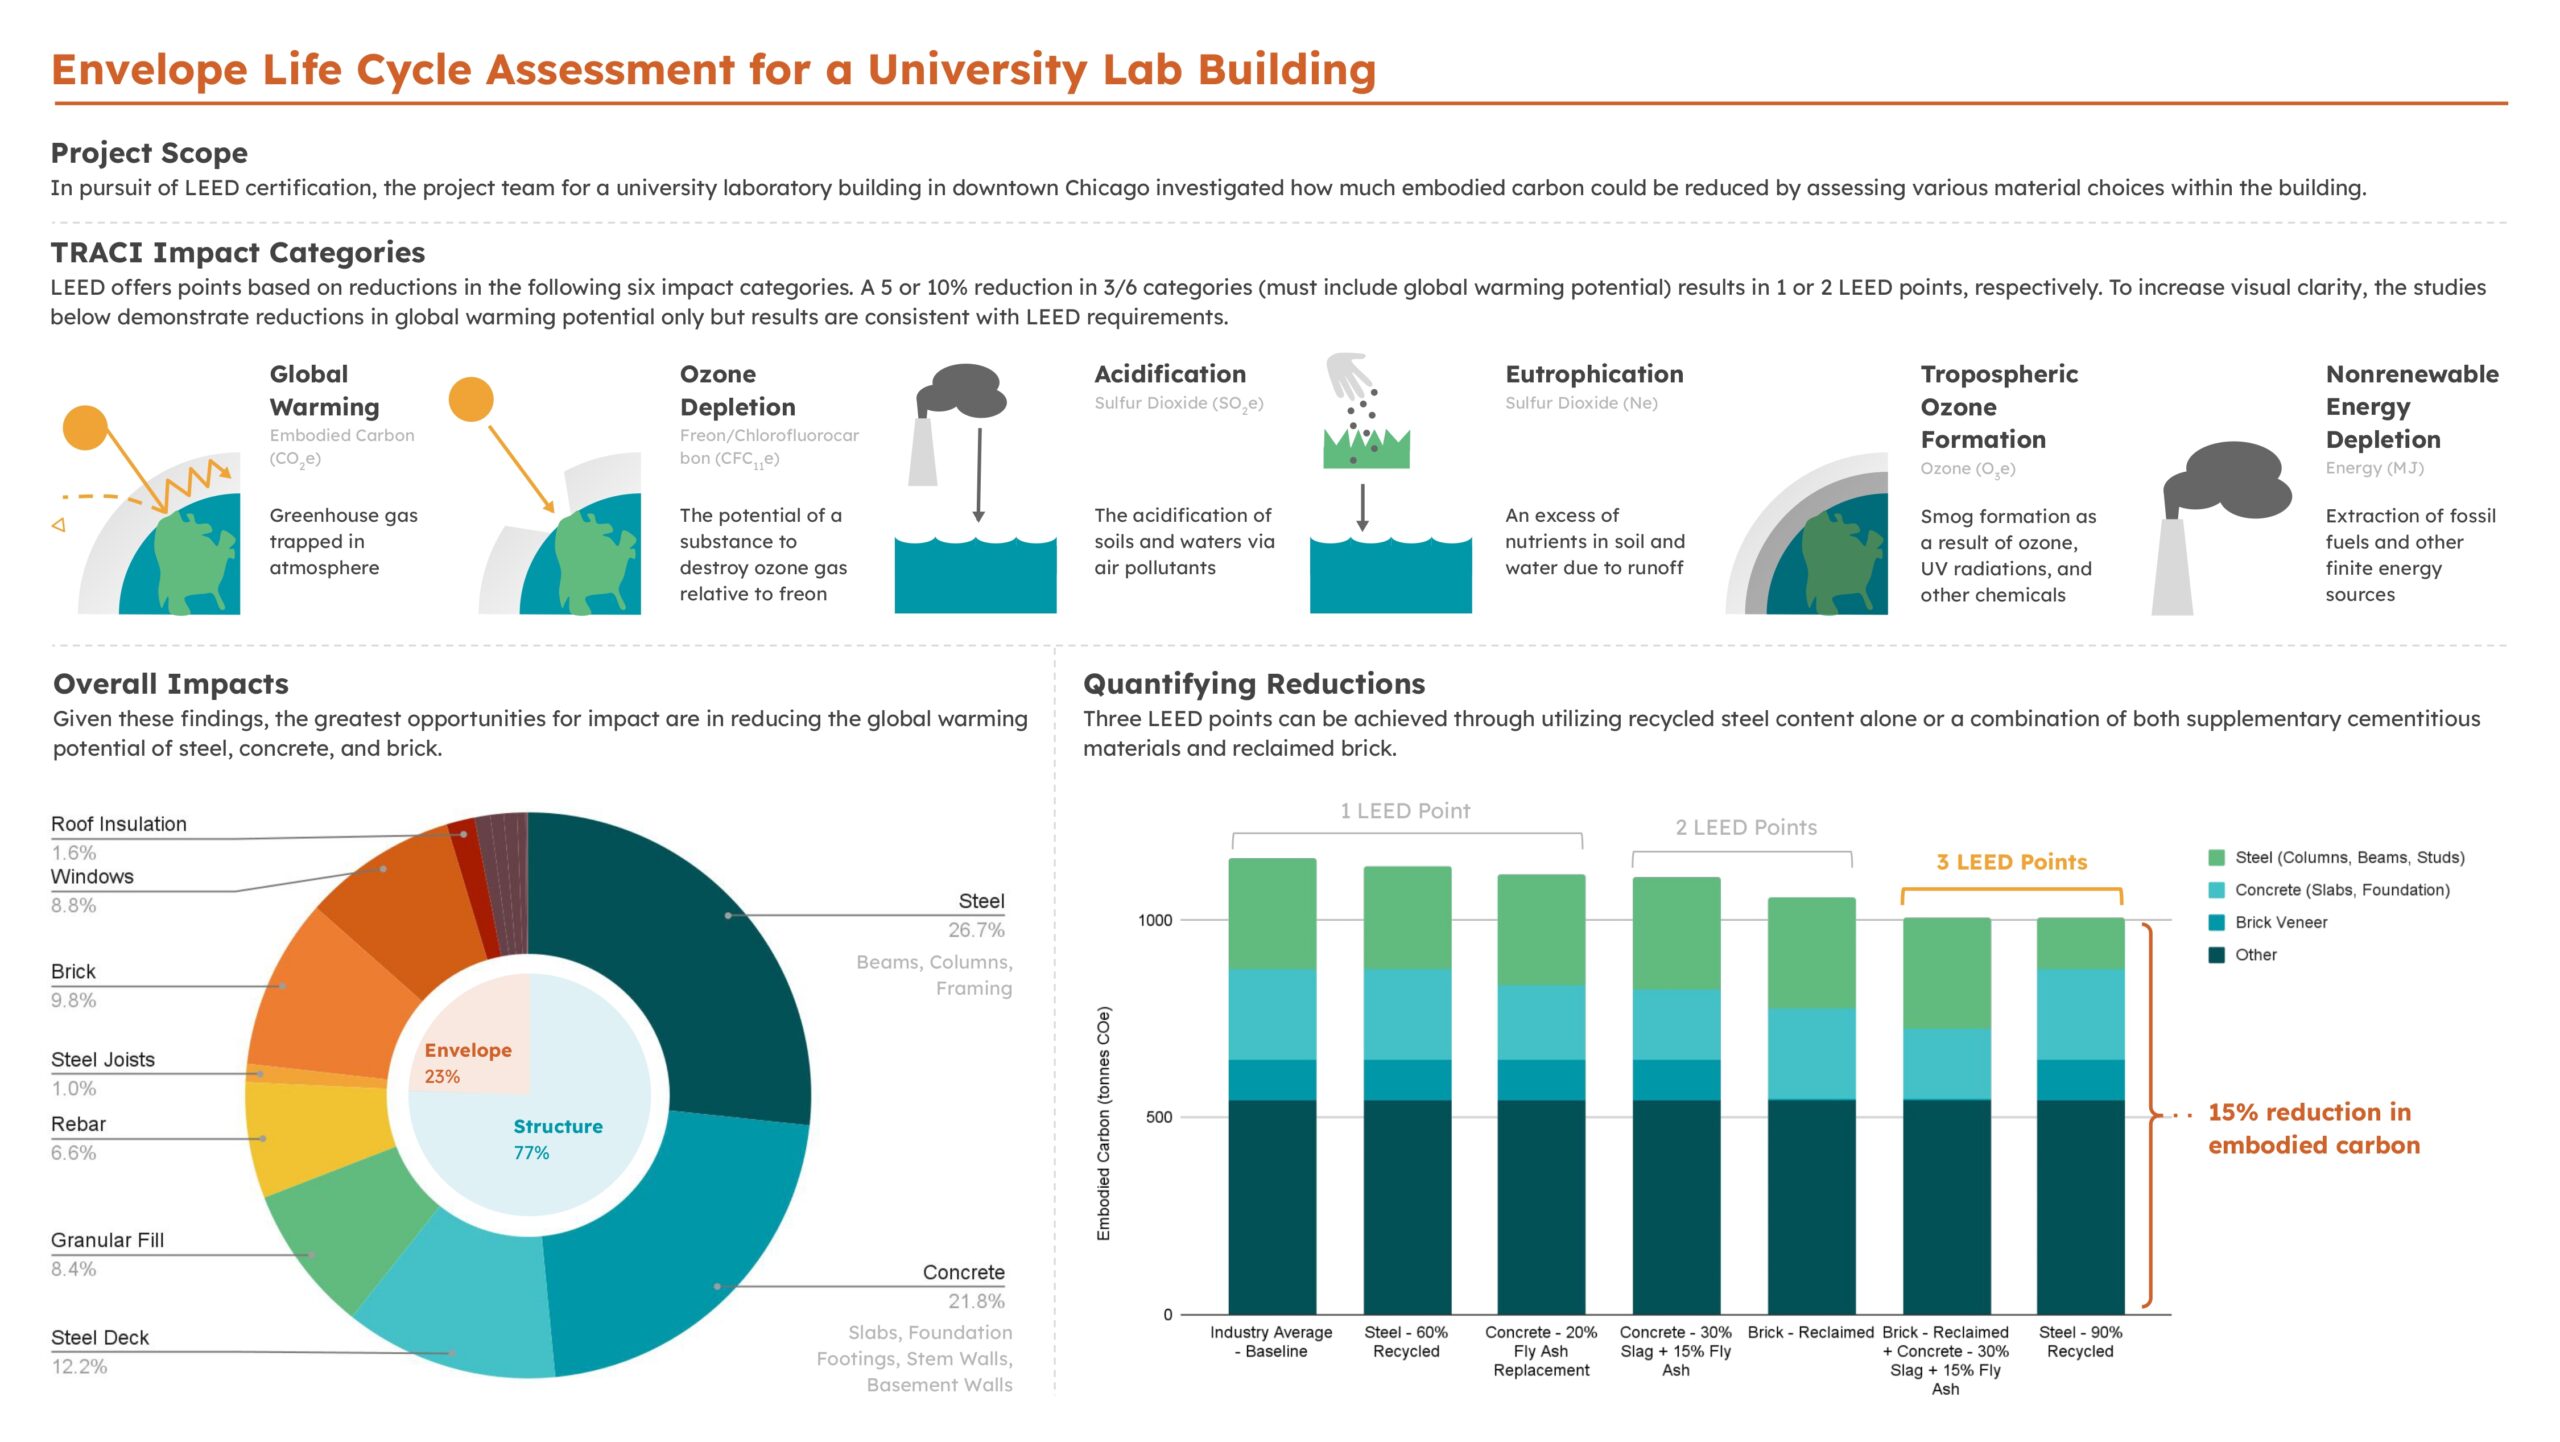
What is the impact of life cycle impact reduction strategies on a university lab building?

Project Location: Zone 0A Extremely Hot Humid
Simulation Scale: Whole Building
Application: Real Project
Audience: Owner
What is this graphic showing? Describe the different parts of the graphic and how it communicates the data.
This graphic demonstrates the six impact categories that LEED references for wbLCA points and explores strategies to achieve the maximum number of LEED points . The top section offers a visual of each of the six impact categories. The left donut chart demonstrates relative impacts of various components of the building on embodied carbon. The right stacked bar charts demonstrate various strategies and their relation to potential LEED points and embodied carbon reductions.
What type of graphic is this?
- Case Study / Multiple
Design Variables
- Building Materials
Is this part of the ASHRAE-209 cycle?
What tools were used for the simulation analysis?
- OneClick LCA
What tools did you use to create the graphic?
- Excel
- Other
What was successful and/or unique about the graphic in how it communicates information?
This graphic starts by introducing the idea of an LCA to folks who may not be familiar with the concept already. This education first approach enables us to establish equal footing among all audience members and build on that foundation with more technical analyses as a follow up.
Is there anything else you would like to mention?
Included in the competition:
2024 Annual Project StaSIO Challenge - Deadline 03.30.24
January 18, 2024-November 22, 2024

