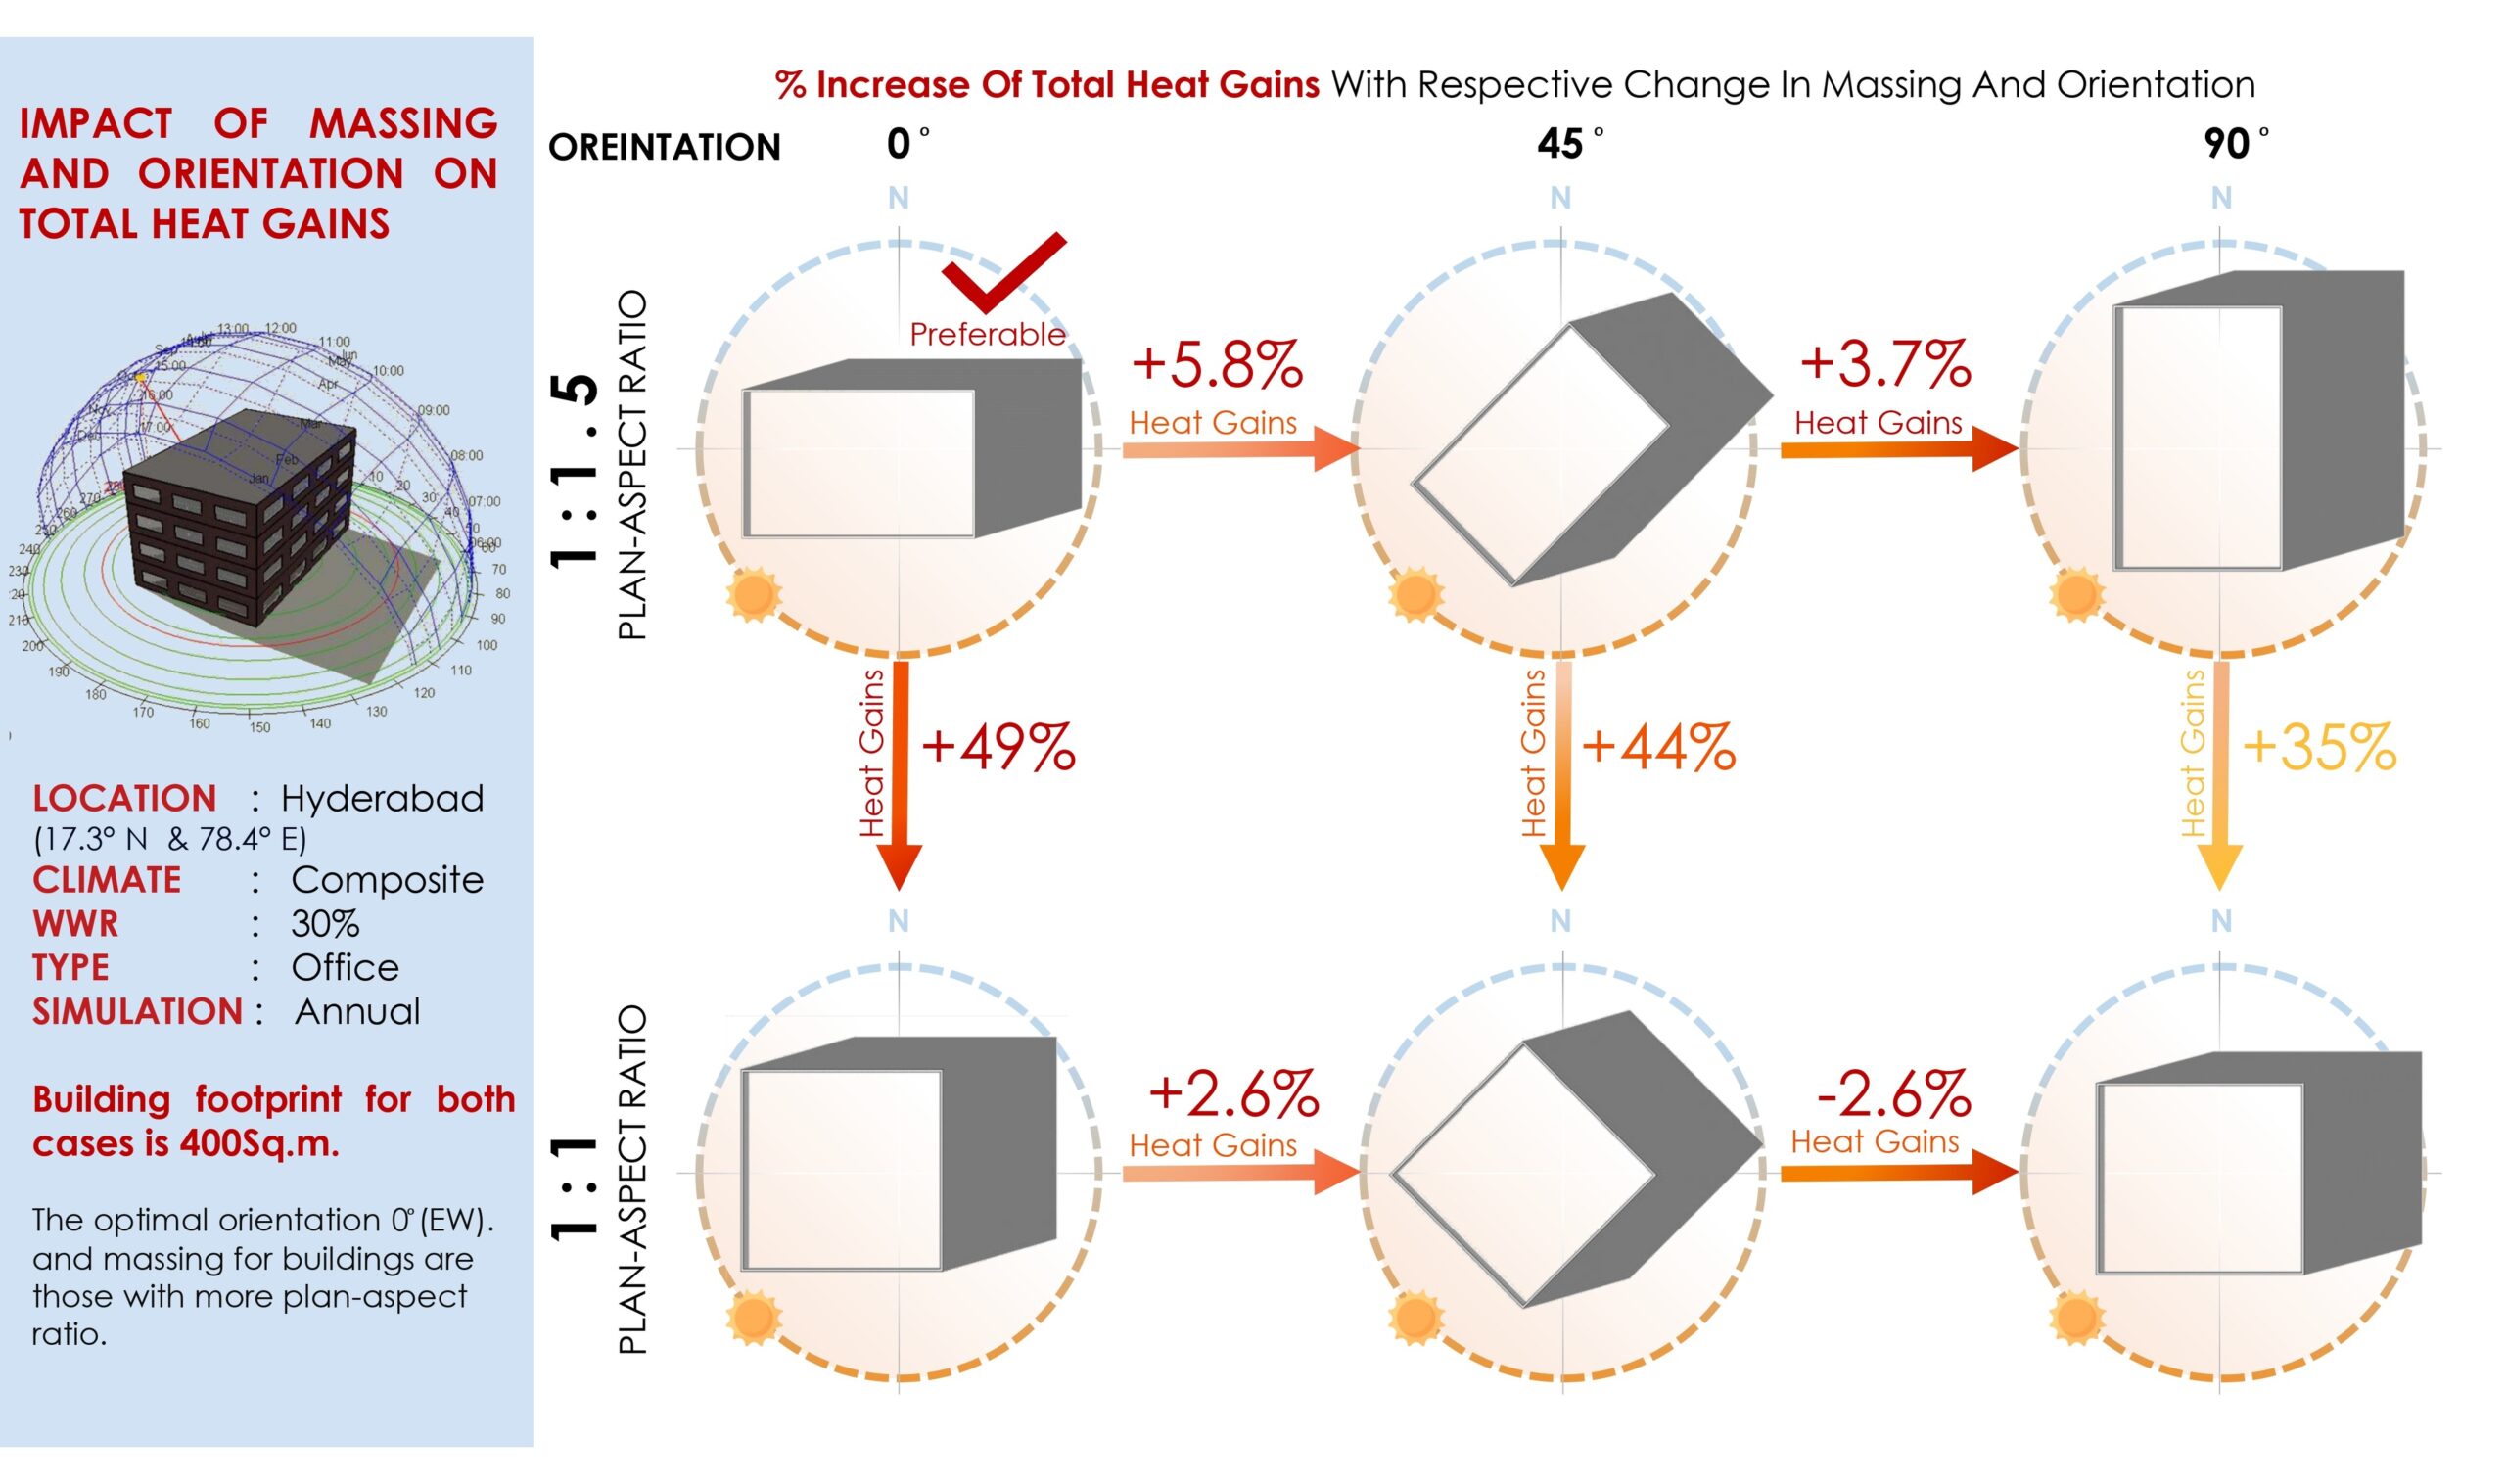
What is the impact of orientation and massing on total heat gains?

Project Location: Zone 0A Extremely Hot Humid
Simulation Scale: Floor Plate
Application: Conceptual
Audience: Academic
What is this graphic showing? Describe the different parts of the graphic and how it communicates the data.
The graphic compares the impact on total heat with changes in building orientation (0°, 45°, 90°) and plan aspect ratio (1:1.5 to 1:1).These factors aid in conceptual stage design decisions considering various options.
What type of graphic is this?
- Case Study / Multiple
Design Variables
- Building Massing
- Building Materials
- Glass U-value / SHGC
- Glazing Fraction/Window to Wall ratio
Is this part of the ASHRAE-209 cycle?
What tools were used for the simulation analysis?
- Design Builder
- EnergyPlus
What tools did you use to create the graphic?
- Excel
- PowerPoint
What was successful and/or unique about the graphic in how it communicates information?
This graphic illustrates the varying impact of different orientations and massing on the total annual heat gain through a building envelope in Hyderabad (Composite). When the building has a plan-aspect ratio of 1:1.5 and is east-west oriented at 0°, lowest total heat gains were observed. The percentage increase in total heat gains is depicted in comparison with the respective change.
Is there anything else you would like to mention?
Selecting appropriate massing and orientation options, considering site context and other parameters, is crucial in the early design phase. This decision significantly impacts building heat gains, leading to future energy and cost savings.
Included in the competition:
2024 Annual Project StaSIO Challenge - Deadline 03.30.24
January 18, 2024-November 22, 2024

