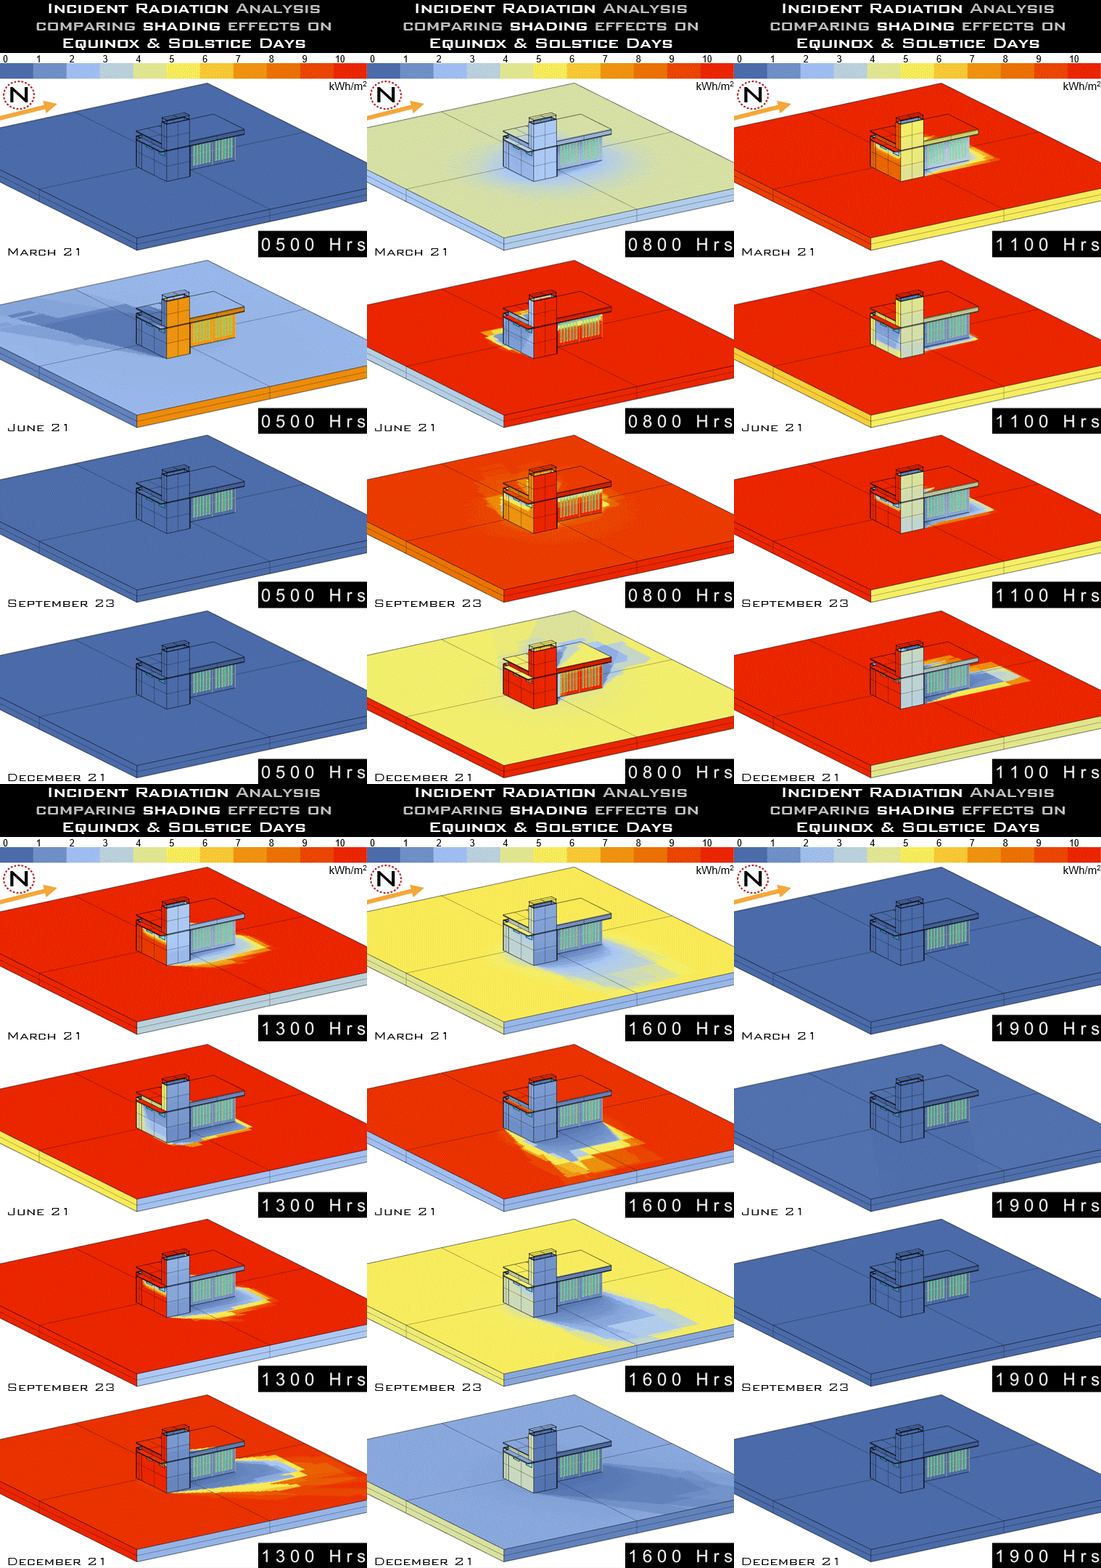
What is the impact of shading devices/ shade on solar incident radiation?

Project Location: Zone 4A Mixed Humid
Simulation Scale: Shoebox Model
Application: Research
Audience: Architect/Designer
What is this graphic showing? Describe the different parts of the graphic and how it communicates the data.
This GIF intends to visualize the solar incident radiation on a building's envelope and its site context during the Equinox and Solstice days. The impact of the shading device on the East facade and shadow cast due to the West sun should especially be noticed with respect to other surfaces around to realize the difference in radiation amount. Also, the depth of the shadows cast on different days and at different times of the day should be taken into account while comparing the differences.
What type of graphic is this?
- Animated gif
Design Variables
- Building Massing
Is this part of the ASHRAE-209 cycle?
What tools were used for the simulation analysis?
- Ladybug Tools
What tools did you use to create the graphic?
- Grasshopper/Rhino
- PowerPoint
What was successful and/or unique about the graphic in how it communicates information?
It is a motion image that shows the solar incident radiation effects on different surfaces on different days but at the exact same time, having differences due to the Sun path.
Is there anything else you would like to mention?
Additional credits and other contributors:
Ming Yan(MSD-EBD23'), University of PennsylvaniaIncluded in the competition:
2024 Annual Project StaSIO Challenge - Deadline 03.30.24
January 18, 2024-November 22, 2024

