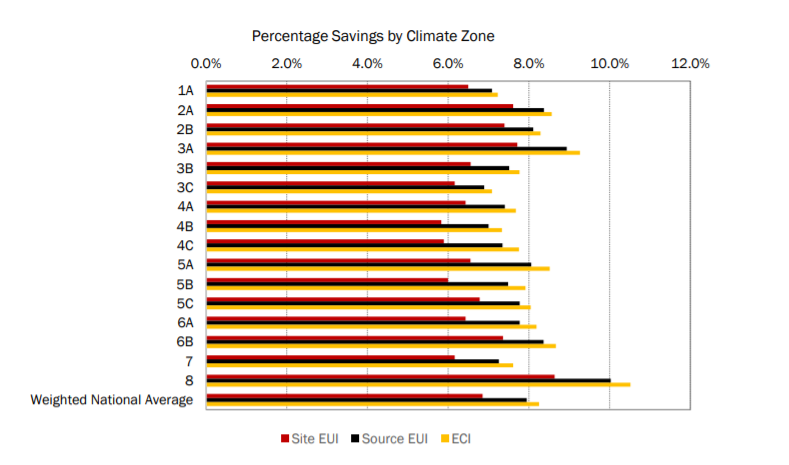
What is the impact of 90.1 2016 code requirements on a building’s EUI?

Project Location:
Simulation Scale:
Application:
Audience:
What is this graphic showing? Describe the different parts of the graphic and how it communicates the data.
The graphic shows energy savings by building type for prototypical buildings complying with 90.1-2016 when compared to 90.1-2013 compliant prototypical buildings.
Design Variables
- Other
Is this part of the ASHRAE-209 cycle?
- Cycle 5 Design Refinement
What tools were used for the simulation analysis?
- EnergyPlus
- Excel
What tools did you use to create the graphic?
- Excel
What was successful and/or unique about the graphic in how it communicates information?
This is a simple graphic which explains the site energy savings and energy cost savings across climate zones and building types.
Is there anything else you would like to mention?
Included in the competition:
Solar Shading and Building Performance
January 7, 2021-February 8, 2021

