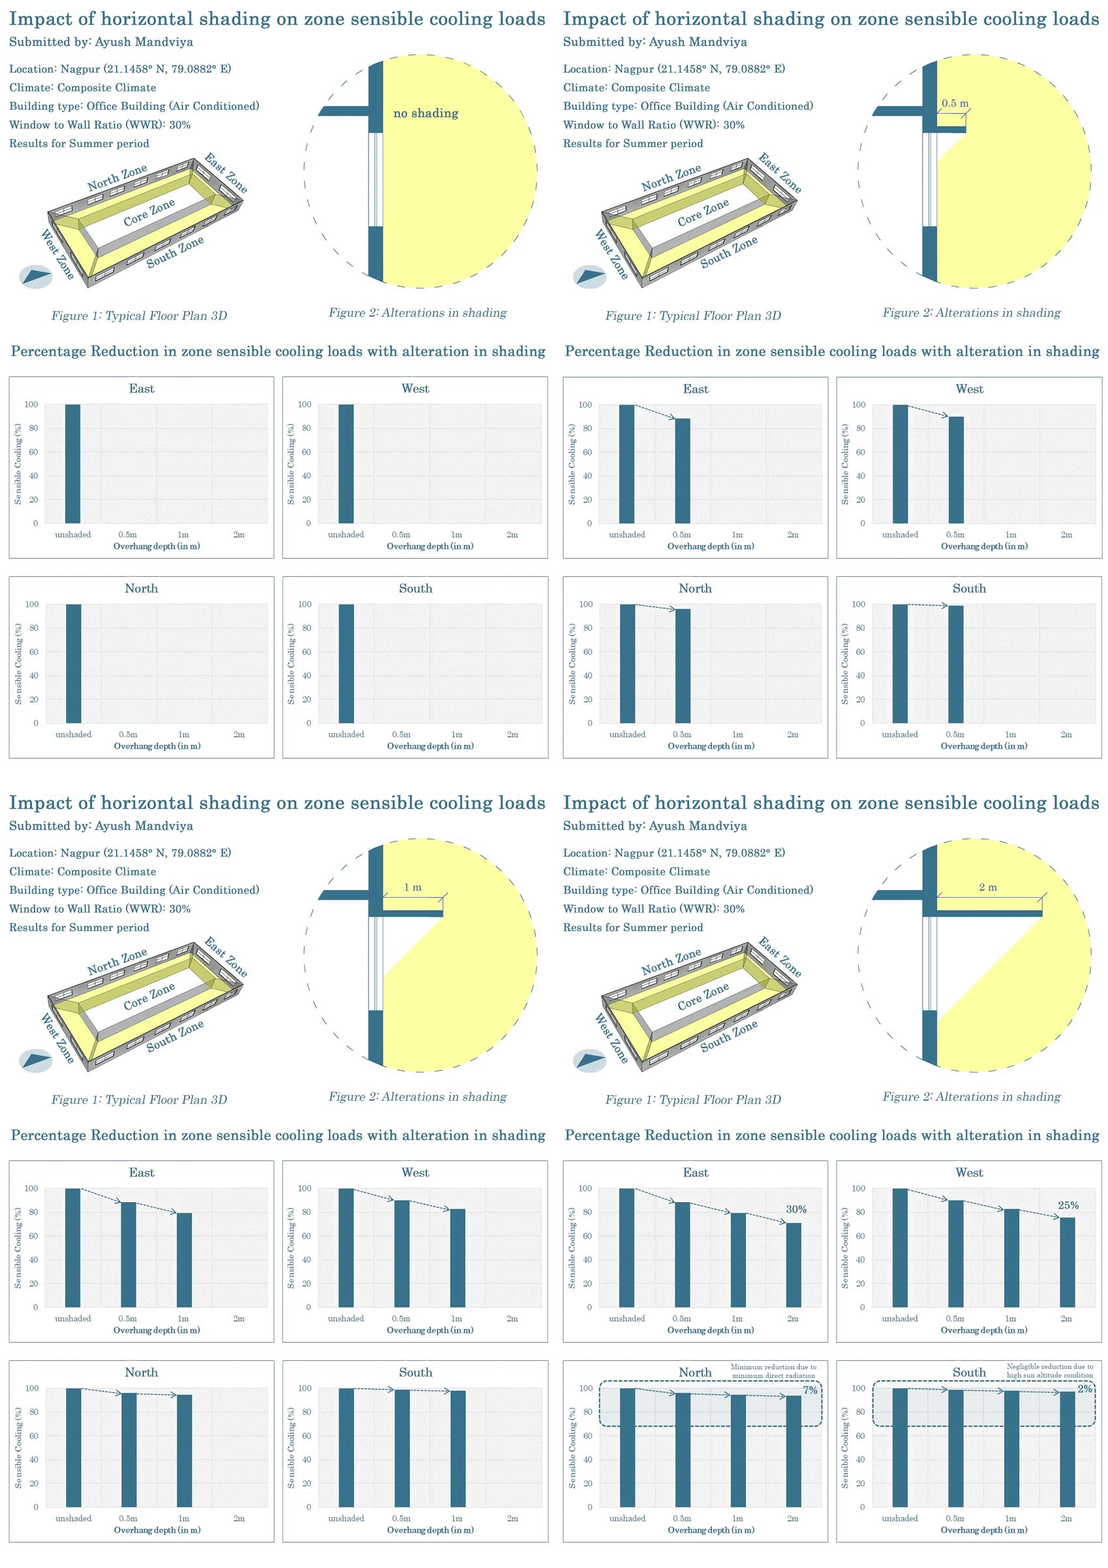
What is the impact of horizontal shading on zone sensible cooling loads?

Project Location:
Simulation Scale:
Application:
Audience:
What is this graphic showing? Describe the different parts of the graphic and how it communicates the data.
The graphics represent the simulation analysis carried out for different overhang sizes for the summer design week. The 3D diagram of a typical floor plan describes the core and perimeter zones. The schematic section represents reduced incident solar radiation on windows by increasing overhang depth. The bar graph gives an overview of the percentage reduction in the zone sensible cooling load by alterations in the overhang depth for the windows in each cardinal direction of the perimeter zones.
What type of graphic is this?
- Animated gif
Design Variables
- Glazing Fraction/Window to Wall ratio
- Window shading/sun control
What tools were used for the simulation analysis?
- Design Builder
What tools did you use to create the graphic?
- Adobe Photoshop
- Excel
- PowerPoint
What was successful and/or unique about the graphic in how it communicates information?
Communicating through a Graphics Interchange Format (GIF) for such an analysis which deals with multiple factors like incident radiation, its impact on zone sensible cooling load with change in projection depth and for each direction, makes one to understand the analysis in a simpler format
Is there anything else you would like to mention?
Included in the competition:
2023 Annual StaSIO Challenge
March 21, 2023-June 12, 2023

