What is the impact of insulation thickness on heat gains?

Project Location:
Simulation Scale:
Application:
Audience:
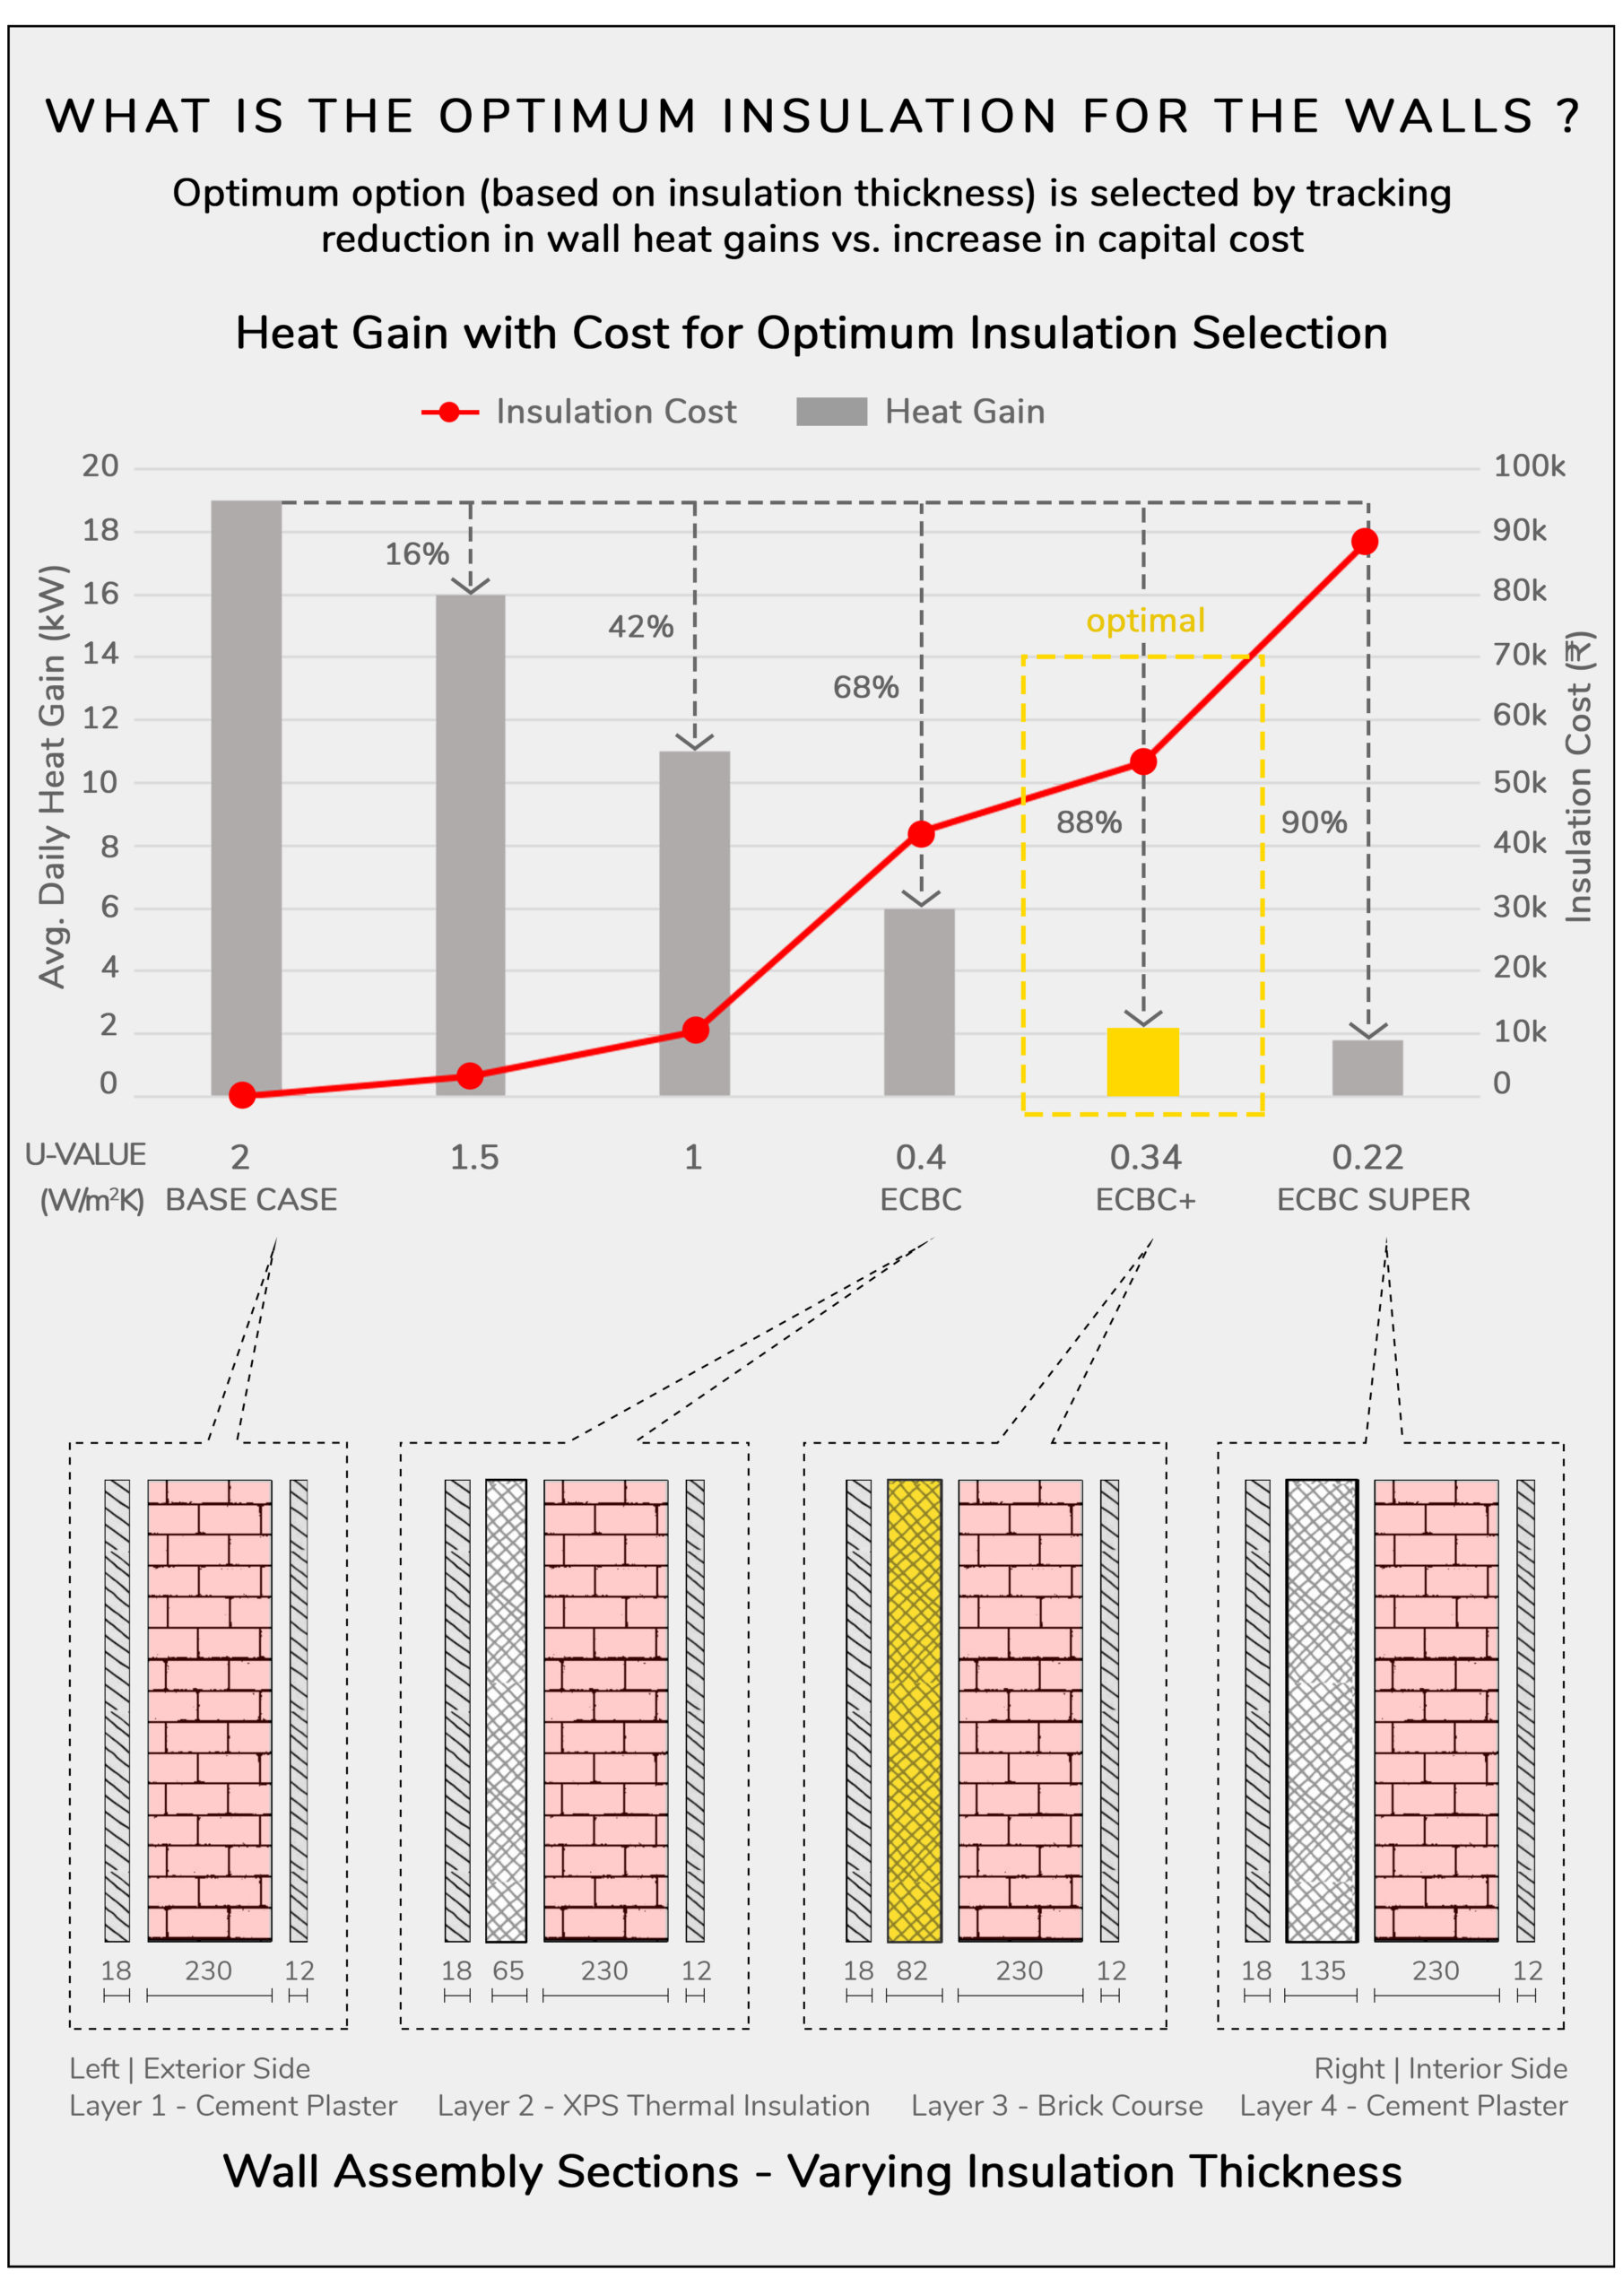
What is this graphic showing? Describe the different parts of the graphic and how it communicates the data.
The presented data is a study on envelope/wall optimization. This graphic conveys the reduction in wall heat gains with increase in insulation thickness. The graph on top depicts wall heat gains with various U-values of wall assemblies with an overlap of insulation cost for optimal option selection. The graphic has wall assembly sections on the bottom to show corresponding insulation thickness.
What type of graphic is this?
- Diagram
- Other
Design Variables
- Building Massing
- Insulation R-value
- Other
What tools were used for the simulation analysis?
- Design Builder
- Excel
What tools did you use to create the graphic?
- Adobe Photoshop
- Excel
What was successful and/or unique about the graphic in how it communicates information?
Arrows and percentage values give quick stats on reducing heat gains. The most optimum case of wall assembly is conveyed through a contrasting color, which corresponds with its wall section. This is easy to identify visually. The 'dialogue box' style markers make it easy to track which wall sections correspond with which U-values.
Is there anything else you would like to mention?
Included in the competition:
2023 Annual StaSIO Challenge
March 21, 2023-June 12, 2023

