What is the impact of active and passive design strategies on predicting Energy Use Intensities for a net zero multi-family use?
Project Location:
Simulation Scale:
Application:
Audience:
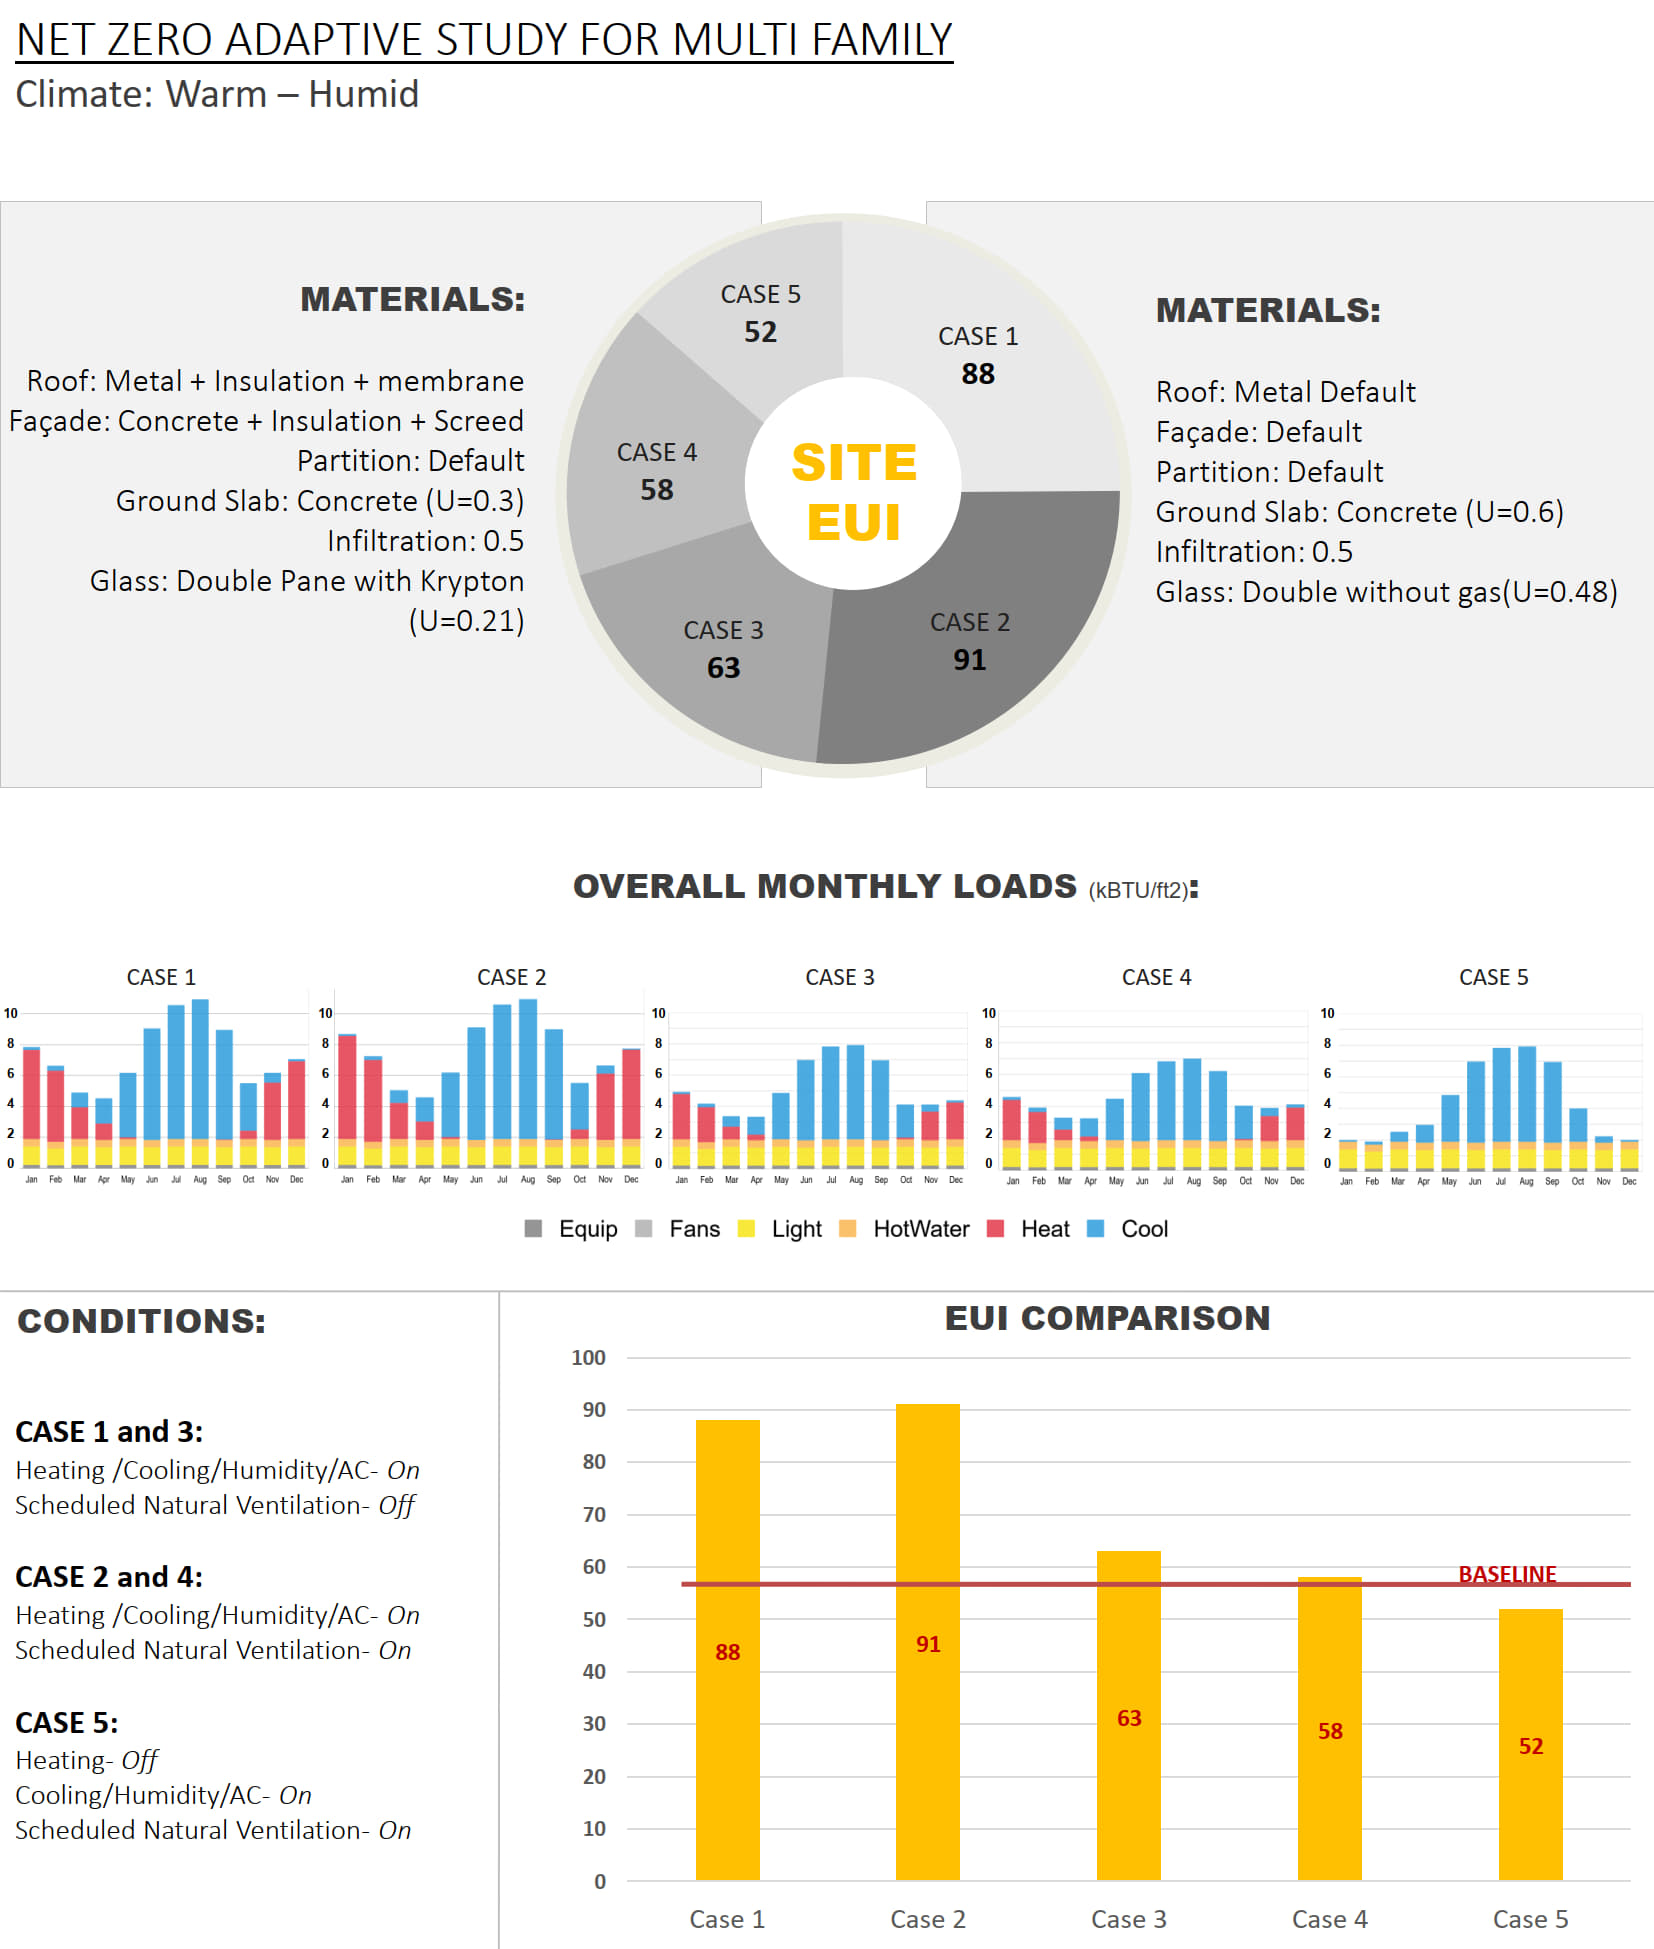
What is this graphic showing? Describe the different parts of the graphic and how it communicates the data.
This graphic communicates the various design cases v/s the baseline energy use intensity (EUI (kbtu/sqft/year)) for predicting a net zero solution based on the climate, mode of ventilation, and envelope properties. A simple box model for one-storey multi-family building is considered with two sets of material applications. These are then coupled with different modes of ventilation to study the overall load distribution including heating, and cooling, to achieve energy efficiency. The final EUIs are plotted for all cases to draw a comparison against the baseline EUI.
What type of graphic is this?
- Diagram
- Table / Chart
Design Variables
- Building Materials
- Glass U-value / SHGC
- HVAC performance/system selection
Is this part of the ASHRAE-209 cycle?
- Cycle 3 Load Reduction
What tools were used for the simulation analysis?
- Ladybug Tools
- Other
What tools did you use to create the graphic?
- Excel
- PowerPoint
What was successful and/or unique about the graphic in how it communicates information?
The graphic attempts to showcase different parameters for defining an energy-efficient solution in comparison to a baseline value, thus predicting the potential of the design. This draws a close understanding of cooling-dominated loads and sets a benchmark for further design calculations.
Is there anything else you would like to mention?
Included in the competition:
2023 Annual StaSIO Challenge
March 21, 2023-June 12, 2023